RYA Ocean Plotting

stephenh

Active member
Joined
6 Jan 2002
Messages
1,320
Location
London UK
Visit site
I was taught at least four - easiest first :

1) Ordinary chart

2) Admiralty plotting sheet e.g. 5333 A

3) Self constructed plotting sheet using D 6018

4) Graph paper, using Traverse tables

A long time ago - there might have been another one and the memory is not so hot ....
:eek:
 

jdc

Well-known member
Joined
1 Dec 2007
Messages
2,007
Location
Falmouth
Visit site
accuracy of sights and plotting

I did an analysis of the accuracy of positions made using sun sights, using pre-computed tables, hand made plotting sheets and the sun-run-sun method with a Walker trailing log for DR.

To do this I made an estimate of the max error of each source (time, plotting accuracy, projection distortion, interpolation errors, altitude measurement etc etc) and the distribution of these errors and convolved the lot to get an overall distribution. To cut a long story short (and to avoid being teased yet again for giving a graph;-), in good weather it turned out to be about 1.5 miles = 1 sigma overall in temperate latitudes, with plotting contributing about +/- 0.75 miles of uncertainty with a 'top hat' distribution.

This purely theoretical result matches well when comparing my actual positions from astro to GPS, so I have some confidence in it.

To make the plotting sheet I use a scale of 2mm = 1 min of latitude (so 1mm = 0.5 miles: plotting should be possible to within +/- 1.5mm).
 

Simes

New member
Joined
19 Jan 2005
Messages
362
Location
IofW
Visit site
There is no specified method of plotting in the RYA Ocean syllabus.
However the most commonly taught method is to use a reduced version of the Universal Plotting Sheet (most instructors will recommend that the student buys a book of these)

These are based up the Mercator projection of the world.

As such the Latitude scale is fixed and the user must apply the correct Longitude Scale from the supplied graph upon the chart.

Once the plotting chart is set-up the positions can be plotted with a good deal of accuracy, +- 1 Mile at our latitude.

Simes
 

stephenh

Active member
Joined
6 Jan 2002
Messages
1,320
Location
London UK
Visit site
Plotting errors

JDC - thats intriguing

"To do this I made an estimate of the max error of each source (time, plotting accuracy, projection distortion, interpolation errors, altitude measurement etc etc)"

Can you still put figures against these estimates?

I would be more than a little interested. I am trying to work out my 'personal error' - I believe it to be a constant.

thanks
 

BlackPig

N/A
Joined
28 Mar 2009
Messages
821
www.scottishensign.co.uk
The method taught at Glasgow nautical college (taught by big ship navigators) was to use graph paper using the same scale for lat and long (departure). Your EP is 0 on the departure. Each time you want to read the longitude you have to do a complex maths problem (for me anyway). departure = dlong x cos men latitude.

I then looked on the this site and found some pro formers amongst them was a simple method were you draw a line at the same angel as you latitude 50 degrees. You then use the same scale as your long but read it off the angled line.

The reason for the posting: Last night I was told by the tutor that ALL rya courses teach the maths method

Thanks for the response.
Graham
 
Last edited:

Skylark

Well-known member
Joined
4 Jun 2007
Messages
7,353
Location
Home: North West, Boat: The Clyde
Visit site
I'm still not sure that I fully understand your question so I'm sorry if I'm slightly off track.

It's quite striaghtforward to create your own plotting sheets.

I use a scale of 1 degree Lat is 12 cm. Then, 2mm is 1 NM.

Long scale = Cos Lat degree x 12 cm.

Using your 50 degree Lat example.

Cos 50 degree x 12 cm = 7.7 cm = 1 degree Long

Hope this helps

David
 

BlackPig

N/A
Joined
28 Mar 2009
Messages
821
www.scottishensign.co.uk
There is no specified method of plotting in the RYA Ocean syllabus.
However the most commonly taught method is to use a reduced version of the Universal Plotting Sheet (most instructors will recommend that the student buys a book of these)

These are based up the Mercator projection of the world.

As such the Latitude scale is fixed and the user must apply the correct Longitude Scale from the supplied graph upon the chart.

Once the plotting chart is set-up the positions can be plotted with a good deal of accuracy, +- 1 Mile at our latitude.

Simes

Thanks for this Simes can I ask are you a RYA instructor? Or where did you get the "There is no specified method of plotting in the RYA Ocean syllabus." info from?
 

capnsensible

Well-known member
Joined
15 Mar 2007
Messages
45,881
Location
Atlantic
Visit site
Hiya.

The Ocean syllabus is in the RYA logbook G15. Section 6 of the Ocean stuff requires that plotting is taught but does not specify any particulars.

As the most common way seems to be to use the standard Imray ones, so do I! Has useful pro formas on the back too.

Familiarity breeds content..........
 

ARO

New member
Joined
14 Jan 2011
Messages
33
Visit site
...Each time you want to read the longitude you have to do a complex maths problem (for me anyway). departure = dlong x cos men latitude.

... a simple method were you draw a line at the same angel as you latitude 50 degrees. You then use the same scale as your long but read it off the angled line.

The "math method" is nothing but a formal descripton of what the "graph method" does.
 

jdc

Well-known member
Joined
1 Dec 2007
Messages
2,007
Location
Falmouth
Visit site
more accurate than one would think!

JDC - thats intriguing

"To do this I made an estimate of the max error of each source (time, plotting accuracy, projection distortion, interpolation errors, altitude measurement etc etc)"

Can you still put figures against these estimates?

I would be more than a little interested. I am trying to work out my 'personal error' - I believe it to be a constant.

thanks

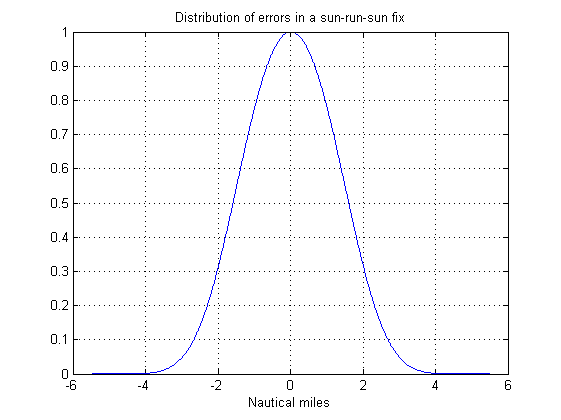
I searched but can't find my original work - on an old computer probably - but I've reproduced this evening a flavor of it. It's complicted because the cross-track error is greater than the along track error (if your log is good), and time errors effect E-W more than N-S. But with some assumptions such as 7 kts, take 3 fixes in a day (8am, mid day and 4pm), sail a straightish course, then the afternoon sight should give an error disribution close to that shown here:
distr.png


and a cumulative probablity as:
cum_distr.png


The ingredients are (I estimate, your mileage may vary):

Altitude measurement: +/-1.5 mins, top-hat distribution
Time: +/- 2 secs. 15 degrees in 60 mins = 15mins per 60 secs = 1 mile per 4 secs
tables: 0.3 mins, top-hat distribution
interpolation: 0.2 mins, top-hat distribution
plotting: 0.75 miles, top-hat distribution
DR along track: 1% of distance = 1 sigma. Distance = 4 hrs at 7 kts 28 miles * 1% = +/-0.3 miles
DR cross track: +/-2.5 degrees 1 sigma = 0.05 radians -> 1/20 of distance = 1.5 miles
combine DR errors as a single geometric mean, so error = sqrt(0.3 * 1.5) = 0.67 (truncated gaussian distribution)
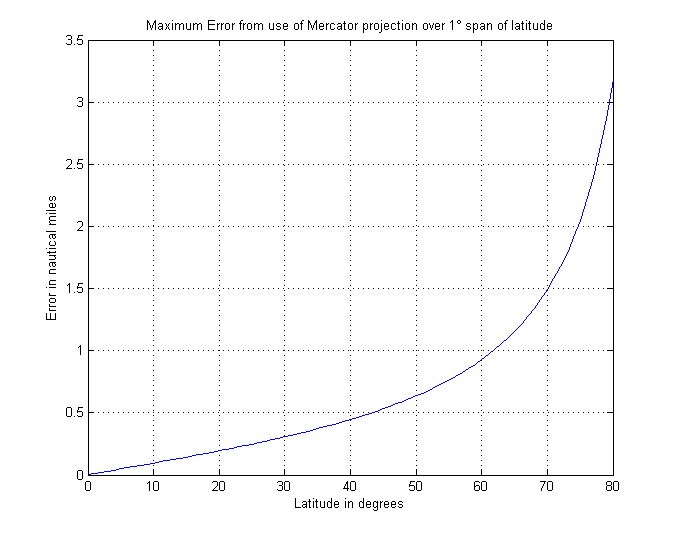
%projection distortion. rms err = 0.7 miles, per 30 miles / sqrt(2) = 0.25miles (depends on course and on latitude). see
MercatorError.png


I'm afraid the analysis is a bit rough - it's getting late and I'm losing the will to live! Maybe I'll tidy it over the w/e.
 
Last edited:

snowleopard

Active member
Joined
16 May 2001
Messages
33,645
Location
Oxford
Visit site
I was taught first with a chart, then to either use a pre-printed plotting sheet or a home-made version. Incidentally I was advised to use a Douglas protractor for plotting intercepts and I still find that the easiest.

I was certainly never taught to do any maths on the figures, they always went straight onto the sheet.

(And I did the course under both BoT and RYA syllabuses)
 

john_morris_uk

Well-known member
Joined
3 Jul 2002
Messages
27,789
Location
At sea somewhere.
yachtserendipity.wordpress.com
I was taught first with a chart, then to either use a pre-printed plotting sheet or a home-made version. Incidentally I was advised to use a Douglas protractor for plotting intercepts and I still find that the easiest.

I was certainly never taught to do any maths on the figures, they always went straight onto the sheet.

(And I did the course under both BoT and RYA syllabuses)
I agree - I teach and examine for the RYA and if you were to ask my advice, I would also suggest a Douglas Protractor for plotting but you can choose whatever works for you.

Regarding the plotting method - there is no 'RYA approved' way - but common practice is to use plotting sheets or graph paper.

Just convince me you know what you are doing and have some sun run sun sights plotted from a passage at sea.

Did you know that the sights you submit and talk through don't even have to be from your qualifying passage - you can just sail out into the channel (or anywhere in the world) and take some sights.

For example when I was examined for my RYA Ocean ticket my submitted sights were from a power boat in the Med' - just off Antibes and in sight of land. I still got quizzed about them and my sight reduction methods and plotting...
 

alant

Active member
Joined
30 May 2001
Messages
37,599
Location
UK - Solent region
Visit site
The method taught at Glasgow nautical college (taught by big ship navigators) was to use graph paper using the same scale for lat and long (departure). Your EP is 0 on the departure. Each time you want to read the longitude you have to do a complex maths problem (for me anyway). departure = dlong x cos men latitude.

I then looked on the this site and found some pro formers amongst them was a simple method were you draw a line at the same angel as you latitude 50 degrees. You then use the same scale as your long but read it off the angled line.

The reason for the posting: Last night I was told by the tutor that ALL rya courses teach the maths method

Thanks for the response.
Graham

"Last night I was told by the tutor that ALL rya courses teach the maths method"

No, I think most use the proforma draw a line at your Latitude method.

maths methods require more thinking, probably a calculator, which defeats the prime objective. Can use a software prog, but would you?
 

Secret Smile

New member
Joined
23 Feb 2011
Messages
21
Location
On Board
Visit site
Straight on to chart

When I qualified there were 2 of us and only a couple of plotting sheets. We were on a transatlantic trip and therefore could not nip out to a local shop.

So we practiced by plotting direct on to a chart. In my experience (albeit limited) people seem to get more acurate the more they do it. We took sights every day - although astro nav is only part of the ocean qualification and the part most seem to concentrate on - we needed to also prove our leadership of crew and management of various systems. (fuel, water, electric and waste management to name but some )

By the time we got to St Lucia we were getting accuracy to under 5 nautical miles - certainly good enough for successful submission.

I actually now prefer to plot direct on chart - although I am aware that you could end up scrawling all over your charts - just me light handed and they come off just fine. You also do not have to carry additional pads of plotting sheets - especially when the ocean voyager will always be short on valuable storage space.

Just a thought.
 

snowleopard

Active member
Joined
16 May 2001
Messages
33,645
Location
Oxford
Visit site
Did you know that the sights you submit and talk through don't even have to be from your qualifying passage - you can just sail out into the channel (or anywhere in the world) and take some sights.

Yes, mine were taken from the bridge of a square rigger. The height of eye entered as 20 ft raised the examiner's eyebrows though!
 
Top