BlackPig
N/A
HI All, what method of plotting were you taught on the course. How did you find that method easy of use to accuracy.
Thanks
Graham
Thanks
Graham
HI All, what method of plotting were you taught on the course. How did you find that method easy of use to accuracy.
Thanks
Graham
")
There is no specified method of plotting in the RYA Ocean syllabus.
However the most commonly taught method is to use a reduced version of the Universal Plotting Sheet (most instructors will recommend that the student buys a book of these)
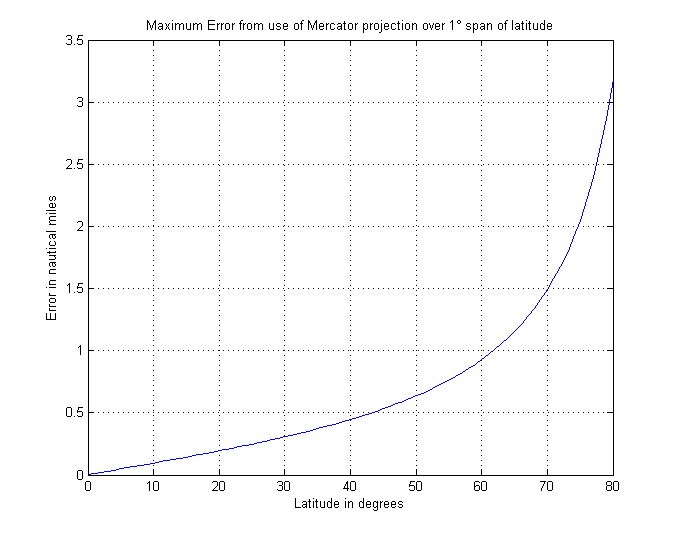
These are based up the Mercator projection of the world.
As such the Latitude scale is fixed and the user must apply the correct Longitude Scale from the supplied graph upon the chart.
Once the plotting chart is set-up the positions can be plotted with a good deal of accuracy, +- 1 Mile at our latitude.
Simes
...Each time you want to read the longitude you have to do a complex maths problem (for me anyway). departure = dlong x cos men latitude.
... a simple method were you draw a line at the same angel as you latitude 50 degrees. You then use the same scale as your long but read it off the angled line.
JDC - thats intriguing
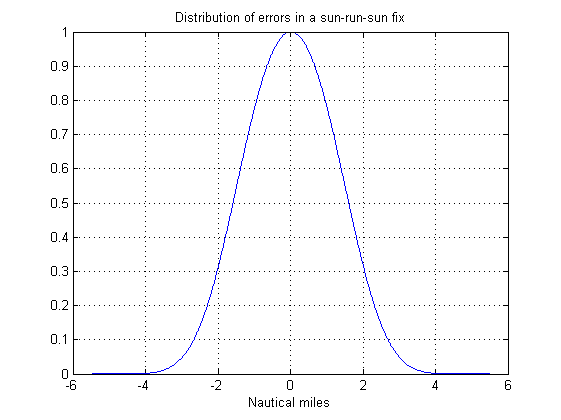
"To do this I made an estimate of the max error of each source (time, plotting accuracy, projection distortion, interpolation errors, altitude measurement etc etc)"
Can you still put figures against these estimates?
I would be more than a little interested. I am trying to work out my 'personal error' - I believe it to be a constant.
thanks

I agree - I teach and examine for the RYA and if you were to ask my advice, I would also suggest a Douglas Protractor for plotting but you can choose whatever works for you.I was taught first with a chart, then to either use a pre-printed plotting sheet or a home-made version. Incidentally I was advised to use a Douglas protractor for plotting intercepts and I still find that the easiest.
I was certainly never taught to do any maths on the figures, they always went straight onto the sheet.
(And I did the course under both BoT and RYA syllabuses)
The method taught at Glasgow nautical college (taught by big ship navigators) was to use graph paper using the same scale for lat and long (departure). Your EP is 0 on the departure. Each time you want to read the longitude you have to do a complex maths problem (for me anyway). departure = dlong x cos men latitude.
I then looked on the this site and found some pro formers amongst them was a simple method were you draw a line at the same angel as you latitude 50 degrees. You then use the same scale as your long but read it off the angled line.
The reason for the posting: Last night I was told by the tutor that ALL rya courses teach the maths method
Thanks for the response.
Graham
Did you know that the sights you submit and talk through don't even have to be from your qualifying passage - you can just sail out into the channel (or anywhere in the world) and take some sights.