Tidal coefficient

Chiara’s slave

Well-known member
Joined
14 Apr 2022
Messages
7,638
Location
Western Solent
Visit site
You can extend the range of your soundings by tieing a lead line to the end of your stick and crouching in the bow. Around 2m of line is plenty.

I consider myself very lucky to have been taught coastal navigation by 3 different people who were Members of the Royal Institute of Navigation, amongst others. The are lots of ways, as I mentioned, to do this. Happily for me it was in the kinda decca/ GPS changeover.

When I sail others boats in a gadget free environment, I remain happy!

Another thing that I found fascinating was reading about ww2 minesweeper navigators operating in the Dover Staits. Transits, bearings, tide height and tide stream calculations to a very high accuracy using the tables of the era. Whist getting shot at by enemy aircraft!!

However, the great thing about plotters, etc is the way they've opened up navigation and made it a lot easier so encouraging more peeps to have a go. On Thursday, we are going out on my oppos Fairline 47 as I want to show him some 25 to 30 knot quick nav techniques whilst we go for a whizz around the Island of Lobos. Electronics will be involved.....and transits and clearance bearings!
It is indeed great that navigation has become so accessible. Having a large cockpit mounted plotter certainly opens up our possibilities and improves navigational safety. It’s almost exclusively just the 2 of us on our boat. As to the line on the stick idea, technically that is out of class rules, believe it or not. We might get away with it if we tied some mackerel lures on it and claimed to be fishing🤣 But not from the foredeck, that isn’t allowed either.
 

ylop

Well-known member
Joined
10 Oct 2016
Messages
2,453
Visit site
Think we are talking mostly about stream rates. 10% in height is roughly the possible variance, we certainly get that routinely in the Solent. But definitely 25% in stream rate.
Ah i thought you were talking about the pdf you replied to which looked like a standard tide table. There was a poster in Tobermory last time I was in which compared actual versus predicted tide. I didn't study the numbers - but I think its was MOSTLY pretty good, but sometimes exceptionally wrong! Streams here vary depending on how close to centre of channel etc you are so 25% is likely and I've never been trying to get an absolute number.
 

Sandy

Well-known member
Joined
31 Aug 2011
Messages
21,818
Location
On the Celtic Fringe
duckduckgo.com
Another thing that I found fascinating was reading about ww2 minesweeper navigators operating in the Dover Staits. Transits, bearings, tide height and tide stream calculations to a very high accuracy using the tables of the era. Whist getting shot at by enemy aircraft!!
Some fascinating stuff on YouTube about WWII air navigation.
 

MontyMariner

Well-known member
Joined
7 Apr 2011
Messages
805
Location
Somerset / Dorset border
montymariner.co.uk
Monty Mariner. Where are you?
Thanks for the heads up, but my input won't be too helpful as although I am aware of the coefficient system I've never used it.
I've always interpolated from Admiralty tide stream charts and found that adequate for the areas I said in.
Now, with the advent of Chart Plotters and their ability to set date and time and indicate tide direction and flow rate, if I need that specific information I use that.
 

Nimrod18

Member
Joined
18 Dec 2018
Messages
74
Visit site
One follow up. I use the Imray Tides app, that has a “Np -> Sp” percentage at the top. Anyone informed enough to know if this in anyway relates to coefficients, or just tells you how far between the most adjacent neaps and springs you are? My instinct is the latter, but based on a very limited sample size of looking (I’m lazy)…
FWIW, I have now done enough experimentation to conclude that the Imray app “Np -> Sp” % value only tells you progression through the sequence between adjacent neaps and springs. Reliably cycles between 0% and 100% and back.

Therefore to understand the Springiness of a Spring or the Neapiness of a Neap, I will need to source the TC data from somewhere - the table in previous link perhaps or - thanks to whoever pointed it out, looking at a French location on the Imray tide app, as they display coefficient (regardless it seems of phone’s location).

One observation gusting frustration. Noting that the French have been central to the metric system, why oh why peg MHWS as 95% and not 100%? There must be a rationale, but I can’t see it just yet; a stats thing? Has echos of the Fahrenheit system (and for a laugh, worth a Google of the John Finnemore sketch on Fahrenheit vs Celsius - with apologies to any USA cousins in advance).
 

Roberto

Well-known member
Joined
20 Jul 2001
Messages
5,390
Location
Lorient/Paris
sybrancaleone.blogspot.com
One observation gusting frustration. Noting that the French have been central to the metric system, why oh why peg MHWS as 95% and not 100%? There must be a rationale, but I can’t see it just yet; a stats thing?
A bit of history :) Coefficients were introduced by Laplace, he defined tidal coefficient C=(H - N0)/U , where H-> HW of the present cycle, N0 --> Mean Sea Level, U --> Height Unit (defined as the average of tidal amplitude [=half range] of the highest HW following by about 1.5 day the Full/New moon instant, around equinox springs).
As coefficients are originally computed for Brest, Brest U value is 3.05m: this is where the 100 coefficient appears --> a 3.05m amplitude, = 6.10m range is given a coefficient of 100.
From this one gets coefficients for the other characteristics moments of the tidal cycle :
120 for highest range
95 for average springs
70 for average tidal range
45 for average neaps
20 for lowest range

Brest average Spring range = 5.90m, average Neaps range = 2.80m --> 5.90/2.80=95/45; also from coefficients: the highest range is about 6 times the lowest range (120/20)
 

Sandy

Well-known member
Joined
31 Aug 2011
Messages
21,818
Location
On the Celtic Fringe
duckduckgo.com
A bit of history :) Coefficients were introduced by Laplace, he defined tidal coefficient C=(H - N0)/U , where H-> HW of the present cycle, N0 --> Mean Sea Level, U --> Height Unit (defined as the average of tidal amplitude [=half range] of the highest HW following by about 1.5 day the Full/New moon instant, around equinox springs).
As coefficients are originally computed for Brest, Brest U value is 3.05m: this is where the 100 coefficient appears --> a 3.05m amplitude, = 6.10m range is given a coefficient of 100.
From this one gets coefficients for the other characteristics moments of the tidal cycle :
120 for highest range
95 for average springs
70 for average tidal range
45 for average neaps
20 for lowest range

Brest average Spring range = 5.90m, average Neaps range = 2.80m --> 5.90/2.80=95/45; also from coefficients: the highest range is about 6 times the lowest range (120/20)
Thanks, that's interesting.

I think I shall stick to the way I know and use the tidal atlas and the more usual, 'its springs the tide will be moving faster than yesterday', method in my passage planning.

I am one of these navigators who does not get paranoid if they don't know to within three seconds (in old money of a Lat/Long) where they are on the planet.
 

Chiara’s slave

Well-known member
Joined
14 Apr 2022
Messages
7,638
Location
Western Solent
Visit site
That’s our philosophy too. You use the accuracy you need. If you’re on the approach to Baucette, you go up a gear or 2. If you’re somewhere off Portland, then as long as ‘off’ is over 5 miles, you’re fine. I think many people are drawn in by the 3 decimal points on their plotter.
 

Roberto

Well-known member
Joined
20 Jul 2001
Messages
5,390
Location
Lorient/Paris
sybrancaleone.blogspot.com
Just for info, sometimes in France there is an inappropriate usage of this coefficient stuff, in particular by marina people when asked "is there enough water for my draught at that place": they often refer to coefficient, though coefficients are related to range, not absolute tidal height, in other words the same coefficient can have different absolute LW and HW, which is what eventually matters for touching the ground or not.
Likewise, "rising coefficients" do not automatically mean the next HWs will be higher than the previous ones, it's often the case but not always.
 

wonkywinch

Well-known member
Joined
30 Jul 2018
Messages
2,054
Location
Hamble, UK
Visit site
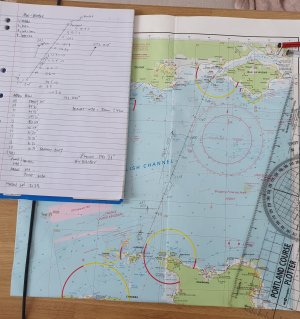
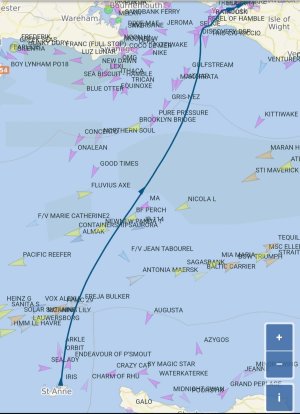
If anyone has doubts about forecast tidal streams and coefficients, I recently crossed the channel Alderney to Fairway/IOW.

I worked out effect of stream for the crossing and came up with a CTS of 010 degrees. I was curious how it would work out so I set the autopilot to 010 and trimmed sails/ran engine to motorsail to hold min 6kts on that heading.

The AIS track shows it delivered us to the right spot after 8 hours. I didn't adjust course at all during the crossing, even the shipping lane traffic left suitable gaps for me as if by magic.

Faint pencil marks previous crossing. Hugged coast into Solent avoiding worst of foul tide.

20240726_102404.jpgScreenshot_20240828_092451_Gallery.jpg
 

wonkywinch

Well-known member
Joined
30 Jul 2018
Messages
2,054
Location
Hamble, UK
Visit site
I think many people are drawn in by the 3 decimal points on their plotter.
That always amuses me until I point out one nm = 1852m. One decimal place is 185m, second 18.5m, the third 1.85m, the average height of a person or half the width of a modern AWB.

One decimal place usually more than sufficient to eyeball an object unless its foggy.
 

Nimrod18

Member
Joined
18 Dec 2018
Messages
74
Visit site
A bit of history :) Coefficients were introduced by Laplace, he defined tidal coefficient C=(H - N0)/U , where H-> HW of the present cycle, N0 --> Mean Sea Level, U --> Height Unit (defined as the average of tidal amplitude [=half range] of the highest HW following by about 1.5 day the Full/New moon instant, around equinox springs).
As coefficients are originally computed for Brest, Brest U value is 3.05m: this is where the 100 coefficient appears --> a 3.05m amplitude, = 6.10m range is given a coefficient of 100.
From this one gets coefficients for the other characteristics moments of the tidal cycle :
120 for highest range
95 for average springs
70 for average tidal range
45 for average neaps
20 for lowest range

Brest average Spring range = 5.90m, average Neaps range = 2.80m --> 5.90/2.80=95/45; also from coefficients: the highest range is about 6 times the lowest range (120/20)
Degree-level; no, Doctorate-level response. Appreciate it.

Measure with a micrometer, cut with an axe. Whatever your philosophy for getting betwixt A and B, and however you account for other variables that impact tides, this is still very interesting.
 

franksingleton

Well-known member
Joined
27 Oct 2002
Messages
3,645
Location
UK when not sailing
weather.mailasail.com
Thanks for the heads up, but my input won't be too helpful as although I am aware of the coefficient system I've never used it.
I've always interpolated from Admiralty tide stream charts and found that adequate for the areas I said in.
Now, with the advent of Chart Plotters and their ability to set date and time and indicate tide direction and flow rate, if I need that specific information I use that.
My memory must be. Worse than I realised. I have seen tidal stream charts on a page by you of tidal streams. The charts all say montymariner.co.uk. Values w are of one value only. My understanding was that applying a tidal coefficient yo the values, gave the expected stream strength . I have copies of the charts.
 

capnsensible

Well-known member
Joined
15 Mar 2007
Messages
46,423
Location
Atlantic
Visit site
That’s our philosophy too. You use the accuracy you need. If you’re on the approach to Baucette, you go up a gear or 2. If you’re somewhere off Portland, then as long as ‘off’ is over 5 miles, you’re fine. I think many people are drawn in by the 3 decimal points on their plotter.
I feel good if my astro fix is within 3 miles of where I am when I check it on a GPS. Training fixes, of course. As I relearn, it's great to turn gadget off and relax. We'll apart from flogging over the tables, trying not to miss noon, losing vital stars or planets behind clouds, yadda yadda!
 

Fr J Hackett

Well-known member
Joined
26 Dec 2001
Messages
66,650
Location
Saou
Visit site
My memory must be. Worse than I realised. I have seen tidal stream charts on a page by you of tidal streams. The charts all say montymariner.co.uk. Values w are of one value only. My understanding was that applying a tidal coefficient yo the values, gave the expected stream strength . I have copies of the charts.
Yes they may well do but how accurate the numbers are is not clear and in any case the tidal flow in each direction will be augmented by a similar amount so the net result will be the same or as close as makes no difference.
 

Sandy

Well-known member
Joined
31 Aug 2011
Messages
21,818
Location
On the Celtic Fringe
duckduckgo.com
That’s our philosophy too. You use the accuracy you need. If you’re on the approach to Baucette, you go up a gear or 2. If you’re somewhere off Portland, then as long as ‘off’ is over 5 miles, you’re fine. I think many people are drawn in by the 3 decimal points on their plotter.
If I am on the approach to anything the Mk I eyeball is my primary navigation tool.
 

franksingleton

Well-known member
Joined
27 Oct 2002
Messages
3,645
Location
UK when not sailing
weather.mailasail.com
I have only used the coefficients as a quick indicator of how big/small a tide might be. In days long by, when I did my passage planning as per RYA, I think that I would have found the French approach easier.
I am a little amused by the talk about accuracy. Tidal calculations may be a little more accurate than wind prediction, but not much.
 
Top