Imray to stop publishing paper charts

Martin_J

Well-known member
Joined
19 Apr 2006
Messages
4,393
Location
Portsmouth, UK
Visit site
Their website doesn't seem to let you go direct to the article... It's currently the first item on their news page though..

Imray News

Edit: Apologies for adding these two links to the thread so late. I can only say that when I wrote them on my mobile, I could only see the original single post!

Edit v2: and I don't think it took me three hours to actually write them!!
 
Last edited:

requiem

Active member
Joined
20 Mar 2019
Messages
208
Visit site
And I still like to work out a ‘course to steer,’ for cross-tide passages, on a paper chart. In fact, I’m not sure how to do that (construct the triangle of Net tidal set, measure angle, from its tip, to destination) electronically. Hints gratefully received!

If your software doesn't have built-in support, you can achieve the same using multiple EBLs. You can use an existing course line, or if you don't have one, use a long bearing line to represent the desired ground track. Next, add a second bearing line to represent the tidal vector (chain them as needed). Depending on your software, either swing a final bearing line to connect with the ground track after the appropriate length, or if that's problematic you can use a VRM centered on the end of the tidal vector to find the intersection with the ground track and then drop the final bearing line to connect those points.

I think this is viable in Coastal Explorer, SEAiq, OpenCPN (via the Draw plugin, though a bit wonky), and possibly TimeZero. An even cruder option would be to use a route tool, starting from the desired destination, to first lay in the ground track on a reciprocal course, then the tidal vector, and finally swinging the final leg to find your CTS.
 

John_Silver

Well-known member
Joined
19 Mar 2004
Messages
593
Location
St Mary's Island
allatseawithstargazer.blogspot.com
If your software doesn't have built-in support, you can achieve the same using multiple EBLs. You can use an existing course line, or if you don't have one, use a long bearing line to represent the desired ground track. Next, add a second bearing line to represent the tidal vector (chain them as needed). Depending on your software, either swing a final bearing line to connect with the ground track after the appropriate length, or if that's problematic you can use a VRM centered on the end of the tidal vector to find the intersection with the ground track and then drop the final bearing line to connect those points.

I think this is viable in Coastal Explorer, SEAiq, OpenCPN (via the Draw plugin, though a bit wonky), and possibly TimeZero. An even cruder option would be to use a route tool, starting from the desired destination, to first lay in the ground track on a reciprocal course, then the tidal vector, and finally swinging the final leg to find your CTS.

Lord! Not sure if a B&G Zeus plotter, with Navionics has that stuff? Though there must be an easy way to calculate the typical English Channel / North Sea crossing in there somewhere.
What I actually like to do (mixing paper & electronic) is:
1. Work out my course to steer, allowing for net tide, to a point 2-3 nm up-tide of the destination, on paper.
2. Plot a theoretical ground track, for each run of the tide, again on paper. Then drop waypoints, showing where I should be at each turn of the tide, into the plotter & iPad
This / these waypoint(s) allow me to check:
1. Where I'm likely to be set, in relation to TSS's, windfarms, shoals etc (In case a rethink, of the route, is required)
2. To eyeball the plotter underway, to see how our theoretical track is measuring up v's reality. And tap the pilot up or down a couple of degrees, in pursuit of the perfect 'S' shaped ground track, as I go.
 
Last edited:

requiem

Active member
Joined
20 Mar 2019
Messages
208
Visit site
The costs are in doing surveys, tracking all the various sources of updates to buoys, depths, marinas etc and carefully assessing then applying these changes as updates to the electronic master images - multiplied across hundreds of charts.
It’s the content that costs, not the printing.
I would think such updates are far more easily applied if the data are managed without an analogue step. For example, if the positions of buoys are updated in one database, they can then be passed to another and directly incorporated into electronic charts without someone having to lovingly hand-place them onto a raster chart image. (This isn't really a paper vs. electronic issue, but rather a raster vs. vector issue.)
 

Sandy

Well-known member
Joined
31 Aug 2011
Messages
21,671
Location
On the Celtic Fringe
duckduckgo.com
Why is it madness? If the costs are increasing and the revenues decreasing, it is imperative for Imray to avoid creating losses on charts which might otherwise bring down the other parts of the business, which they are planning to maintain - ie pilot books, Explore With Imray etc.
Because, the Hydrographic Office is withdrawing from the paper chart market. NV Charts, because of the thing that we dare not mention happened, can hardly be found. Does anybody know of any other chart makers?

OK, I am old school. I look at a paper chart when passage planning and when under way. Like maps I can envisage a 3-D picture from a 2-D bit of paper chart plotters don't do that for me.

Looks like I will need to buy every possible folio in the next year or so and I don't suspect for a moment they will be issuing chart updates.
 

Sandy

Well-known member
Joined
31 Aug 2011
Messages
21,671
Location
On the Celtic Fringe
duckduckgo.com
The costs of chart production is NOT in the printing. That can be outsourced to chart retailers, as UKHO has done for years via Print on Demand.
The costs are in doing surveys, tracking all the various sources of updates to buoys, depths, marinas etc and carefully assessing then applying these changes as updates to the electronic master images - multiplied across hundreds of charts.
It’s the content that costs, not the printing.
Imray don't do surveys... they get the data from the Hydrographic Office.

All they are doing is buying the data, looking at it, making some sort of interpretation of the data and printing it.
 

penberth3

Well-known member
Joined
9 Jun 2017
Messages
3,584
Visit site
The costs of chart production is NOT in the printing. That can be outsourced to chart retailers, as UKHO has done for years via Print on Demand.
The costs are in doing surveys, tracking all the various sources of updates to buoys, depths, marinas etc and carefully assessing then applying these changes as updates to the electronic master images - multiplied across hundreds of charts.
It’s the content that costs, not the printing.

So why not offer PoD? Presumably this could be offered 'down the line' to anywhere with a suitable printer?
 

st599

Well-known member
Joined
9 Jan 2006
Messages
7,495
Visit site
Can't blame them If there is no way to make a profit.

Sad ending though. I expect some folks will print off the computer if hard copies required .
Unfortunately all the coded yachts out there need professionally printed charts as the current crop of electronic plotters don't meet the current standards for navigation. There's a new lower standard being written but until product is on the market and cheap enough for.schools and clubs to buy, paper is needed.
 

requiem

Active member
Joined
20 Mar 2019
Messages
208
Visit site
So why not offer PoD? Presumably this could be offered 'down the line' to anywhere with a suitable printer?
I suspect it's the difference between raster & vector, not paper vs electronic. Generating a printable rendition of a vector chart that's "fit for purpose" is not exactly a straightforward endeavour. NOAA in the US has built such a thing, but it's just not the same as the raster charts.

Lord! Not sure if a B&G Zeus plotter, with Navionics has that stuff? Though there must be an easy way to calculate the typical English Channel / North Sea crossing in there somewhere.
Unfortunately that's part of why I consider them toys. It would be an easy feature to add in, but there's little market demand as the ones most likely to use it are ironically also the ones most likely to cling to the belief that paper won't go awayprefer paper.

You might be able to use the "route" method I mentioned with them; I haven't tried it because I use my mobile devices for primary navigation and reserve the plotter for things like radar.
 

st599

Well-known member
Joined
9 Jan 2006
Messages
7,495
Visit site
Unfortunately that's part of why I consider them toys. It would be an easy feature to add in, but there's little market demand as the ones most likely to use it are ironically also the ones most likely to cling to the belief that paper won't go awayprefer paper.
Not prefer, rather be legally obliged to carry.

For a coded vessel to switch to electronic only, the plotter currently requires dual redundant power and GNSS supplies, the ability to override the GNSS plot with a 3 point fix and a relatively large screen (I think 24").

There's a project running to create an easier standard for small coded vessels, but it hasn't published a spec. yet, so there's no product available. Plus without a massive market, it will take a while to be affordable.

The RYA response was, "Don't worry, you can use Imray charts instead of UKHO". I'm assuming the training and club conference may get a bit boisterous again.
 

Dellquay13

Well-known member
Joined
19 Feb 2021
Messages
956
Location
Boat at Milford Haven, Home in Chesterfield
Visit site
An insight of Imray’s operation by Tom Cunliffe. Seemed they did have the capability to print on demand in-house.

They do have a print on demand service.
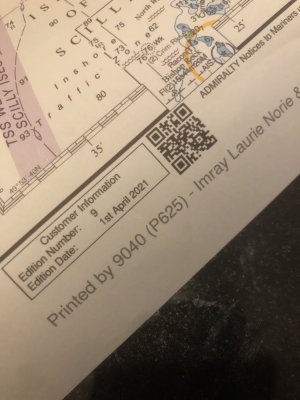
Ironically the last Admiralty chart I bought last year is stamped ‘printed by Imray on Admiralty chart paper
 

Attachments

  • image.jpg
    image.jpg
    1.6 MB · Views: 1
Last edited:

SaltyC

Well-known member
Joined
15 Feb 2020
Messages
472
Location
Yorkshire
Visit site
Unfortunately all the coded yachts out there need professionally printed charts as the current crop of electronic plotters don't meet the current standards for navigation. There's a new lower standard being written but until product is on the market and cheap enough for.schools and clubs to buy, paper is needed.
Unfortunately we are being forced into an electronic era of paying for chart updates. Updating paper charts is gone, welcome to monthly rental. Fortunately rocks do not move, so we can still orientate ourselves with paper 1.2m by 0.9m rather than struggle with a 5" screen that is 'Not to be used for Navigation' (IF e have them). Digital First!!! we now 'shape a course' ie point the COG to our destination, brilliant ( and used by me) racing to marks only 4 miles away but useless across channel and contradicts 50 years of RYA training. I too, use the monkey maths of tide this way, tide that way, aim 5m west / whatever so course is x. afraid not as pedantic to plot wp every hour, just know I will go 'left' or 'right' (N/S or E/W) of intended route then return my overview will let me decde if the track is within tolerance.
 

SaltyC

Well-known member
Joined
15 Feb 2020
Messages
472
Location
Yorkshire
Visit site
Oooops.forgot the summary. We can't buy new paper charts, updates are not available so we have to rely on an electronic box which you have agreed 'is not to be used for navigation' Now claim off your insurance.
 

westernman

Well-known member
Joined
23 Sep 2008
Messages
13,685
Location
Costa Brava
www.devalk.nl
It sounds like there is a bit of a lack of tech here.
After all Vista Print and the likes can print stuff for very little cost from order to picking up the printed result.
We use them for large A0 posters and roller banners from time to time.

It should be possible to order a custom chart of your area so that you are in the center of it, instead of being in the corner of 4 different charts.
I would have thought it would not be difficult to make the business work - may be even outsourcing the printing, folding and sending bit.
 

SaltyC

Well-known member
Joined
15 Feb 2020
Messages
472
Location
Yorkshire
Visit site
It sounds like there is a bit of a lack of tech here.
After all Vista Print and the likes can print stuff for very little cost from order to picking up the printed result.
We use them for large A0 posters and roller banners from time to time.

It should be possible to order a custom chart of your area so that you are in the center of it, instead of being in the corner of 4 different charts.
I would have thought it would not be difficult to make the business work - may be even outsourcing the printing, folding and sending bit.
Or a lack of understanding?
 

AntarcticPilot

Well-known member
Joined
4 May 2007
Messages
10,474
Location
Cambridge, UK
www.cooperandyau.co.uk
Imray don't do surveys... they get the data from the Hydrographic Office.

All they are doing is buying the data, looking at it, making some sort of interpretation of the data and printing it.
But the process of ingesting HO data, reformatting it and then doing the cartographic work to produce the added value for their leisure audience is skilled and time-consuming work. They had a small team of skilled people doing that; we recruited one of them! As others have said, the printing isn't a big cost, but prparing the data for printing is.
 

AntarcticPilot

Well-known member
Joined
4 May 2007
Messages
10,474
Location
Cambridge, UK
www.cooperandyau.co.uk
It sounds like there is a bit of a lack of tech here.
After all Vista Print and the likes can print stuff for very little cost from order to picking up the printed result.
We use them for large A0 posters and roller banners from time to time.

It should be possible to order a custom chart of your area so that you are in the center of it, instead of being in the corner of 4 different charts.
I would have thought it would not be difficult to make the business work - may be even outsourcing the printing, folding and sending bit.
Unfortunately, the nature of charts makes this very difficult. First of all, you would need to have all your data reduced to the same vertical datum - which wouldn't make sense as chart datum varies substantially from place to place. If you put two charts together, there's a fair chance that depth soundings and contours won't match across the divide, because the depth isn't measured with respect to the same vertical datum. Second, you have the issue of merging large and small-scale data, which I have excellent reason to know is NOT simple - I had to do it! But it makes no sense to survey deep water without hazards to the same level of detail as a harbour entrance. Finally, for reasons to do with international agreements to share charts, charts are defined by sheet boundaries.

It isn't impossible, but it would a) require major changes to international agreements and b) an internationally agreed method for reducing the arbitrary datum of the dataset to local LAT.
 

westernman

Well-known member
Joined
23 Sep 2008
Messages
13,685
Location
Costa Brava
www.devalk.nl
Unfortunately, the nature of charts makes this very difficult. First of all, you would need to have all your data reduced to the same vertical datum - which wouldn't make sense as chart datum varies substantially from place to place. If you put two charts together, there's a fair chance that depth soundings and contours won't match across the divide, because the depth isn't measured with respect to the same vertical datum. Second, you have the issue of merging large and small-scale data, which I have excellent reason to know is NOT simple - I had to do it! But it makes no sense to survey deep water without hazards to the same level of detail as a harbour entrance. Finally, for reasons to do with international agreements to share charts, charts are defined by sheet boundaries.

It isn't impossible, but it would a) require major changes to international agreements and b) an internationally agreed method for reducing the arbitrary datum of the dataset to local LAT.
Surely this is already solved when they make a chart covering a large area (for instance all of the western med)?
 

Other threads that may be of interest

Top