jdc
Well-known member
I have constructed a strain-gauge (0-1000kg to 1kg resolution and ~5kg accuracy), which potentially has multiple uses but which I first want to use to measure and display the anchor rode tension in real-time. It outputs NMEA style sentences (but I can make it send any format really). It sends serial data via Bluetooth SPP.
My question is what should I display the readings, or graph of readings vs time, on?
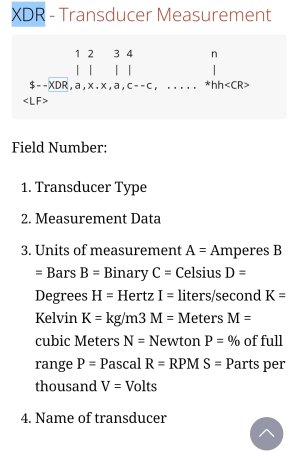
I'd ideally like it to be my chart plotter as that's the only built-in graphical device. Of course I could use my lap-top, but that's a palaver and I don't always take it on board (expensive and fragile and mission critical for work). However NMEA183 or 2000 sentences don't seem to support strain as a measurement, and neither do they allow an arbitrary sentence to be displayed. Any ideas? Represent it as fake 'engine temperature' or other quantity which is supported in NMEA?
FWIW the chart plotter is Raymarine A95.
Last edited:


