Has somebody broken the Met Office weather model?

franksingleton

Well-known member
Joined
27 Oct 2002
Messages
3,585
Location
UK when not sailing
weather.mailasail.com
My point wasn't that it should be perfect, and neither was I attacking weather pros specifically. The problem is that consumers have identified a problem that seems to be consistent and the response has effectively been to tell those consumers they don't understand how weather forecasting works. It's the expert problem I was describing. Sometimes it's good to have a less technical product owner between the experts and the consumers for this very reason.
You have many less technical product owners. Accuweather, Weather Channel, Netweather, MetDesk, Windy, Ventusky, PredictWind, Meteocondult, etc etc there are many more. Perhaps you should ask some of these to do a better job.
 

RunAgroundHard

Well-known member
Joined
20 Aug 2022
Messages
2,099
Visit site
Curious, is there a standard definition for a gust?

Gust | Winds, Turbulence & Air Pressure
gust, in meteorology, a sudden increase in wind speed above the average wind speed. More specifically, wind speed must temporarily peak above 16 knots (about 30 km per hour) after accelerating by at least 9–10 knots (about 17–19 km per hour) to qualify as a gust. A gust is briefer than a squall and usually lasts 20 seconds or less.

I looked at the Met Office web page but could not find a definition.
 

lustyd

Well-known member
Joined
27 Jul 2010
Messages
12,239
Visit site
Curious, is there a standard definition for a gust?
Probably are several, the important thing it to use one that makes sense to the consumer. For sailors if you tell them there may be gusts of 50kt they won't go sailing, but they also won't listen when told that's at 400m above sea level at a grid size of 10km yadda yadda. Some of the weather apps are getting better at converting the raw data to consumable format while others just dump the raw data and hope the user can manage it
 

franksingleton

Well-known member
Joined
27 Oct 2002
Messages
3,585
Location
UK when not sailing
weather.mailasail.com
Wind speed and gust speed used in meteorology depend on users’ needs. The wind speeds in hourly, synoptic, reports are 10 minute means. That is by international convention. It is a figure that is meaningful in terms of aircraft operations, an important customer. It is meaningful to us as sailors. Depending on your experience and the size of your boat, with a 20 kt wind averaged over 19 minutes, you could be thinking of a first reef. Experience is that a 10 minute mean wind meets many needs. I am not aware of any different user requirement.

For climatological purposes, an hourly mean is more meaningful. I am out of touch with current practice but, when I was involved, construction design criteria used hourly means. As with the “synoptic” report criteria, these are internationally agreed values.

When it comes to gusts, definitions of duration depend on use and the ability to measure them. A gust duration of 3 seconds comes to mind and this is the WMO value. I am surprised that the Met Office site does not seem to mention gust duration. However looking at a Met Office glossary of terms published in 1972 and a copy of the Marine Observers Handbook, 1995, neither define the duration of a gust.
 

franksingleton

Well-known member
Joined
27 Oct 2002
Messages
3,585
Location
UK when not sailing
weather.mailasail.com
Probably are several, the important thing it to use one that makes sense to the consumer. For sailors if you tell them there may be gusts of 50kt they won't go sailing, but they also won't listen when told that's at 400m above sea level at a grid size of 10km yadda yadda. Some of the weather apps are getting better at converting the raw data to consumable format while others just dump the raw data and hope the user can manage it
The bottom of NWP models is usually the height where the pressure is 0.998 of the surface pressure so that models are terrain following. Surface values, ie those at the nominal 10m agl level, are determined by algorithms. If anyone wishes to use a different algorithm, that is up to them. I could well imagine someone wanting to improve forecasts for a specific area doing just that. There are limits to what any national forecast service can do. I could well imagine that AI has a useful role here.
 

Marsali_1

New member
Joined
8 Jan 2021
Messages
22
Visit site
... Effectively, I see them as members of a large ensemble. ECMWF runs a 50-member ensemble. Output is on the Meteociel site. A copy of an ensemnle for wind speed is attached. Values are in km/hr. This gives an idea of the uncertainties inherent in NWP models.
As someone who is interested in weather and weather forecasting beyond just wanting to know if tomorrow will be suitable for sailing, I'm wondering could you explain what is meant by, in this case, "50 member ensemble", please? Does that mean 50 variables are part of the ECMWF model or does it refer to something else?
 

Puffin10032

Active member
Joined
5 Jul 2016
Messages
108
Visit site
As someone who is interested in weather and weather forecasting beyond just wanting to know if tomorrow will be suitable for sailing, I'm wondering could you explain what is meant by, in this case, "50 member ensemble", please? Does that mean 50 variables are part of the ECMWF model or does it refer to something else?

This video will hopefully explain ensembles


AntarcticPilot

Well-known member
Joined
4 May 2007
Messages
10,420
Location
Cambridge, UK
www.cooperandyau.co.uk
As someone who is interested in weather and weather forecasting beyond just wanting to know if tomorrow will be suitable for sailing, I'm wondering could you explain what is meant by, in this case, "50 member ensemble", please? Does that mean 50 variables are part of the ECMWF model or does it refer to something else?
It means 50 runs of the same model with small changes to the initial conditions. As weather is intrinsically chaotic, this provides an indication of whether all starting conditions lead to the same result or whether small changes can result in widely divergent results.
 

franksingleton

Well-known member
Joined
27 Oct 2002
Messages
3,585
Location
UK when not sailing
weather.mailasail.com
As someone who is interested in weather and weather forecasting beyond just wanting to know if tomorrow will be suitable for sailing, I'm wondering could you explain what is meant by, in this case, "50 member ensemble", please? Does that mean 50 variables are part of the ECMWF model or does it refer to something else?
Because models are imperfect and, to a lesser extent, data analyses are imperfect, a NWP model is run many times with small input variations. This produces a range of forecasts all of which are possible solutions. See my page at Weather Model Ensembles & Forecast Uncertainty - Franks-Weather - The Weather Window
 

franksingleton

Well-known member
Joined
27 Oct 2002
Messages
3,585
Location
UK when not sailing
weather.mailasail.com
This video will hopefully explain ensembles

That describes why I used to think ensembles are used. However, data analyses have improved in recent years. More important is the fact that we cannot calculate, precisely enough how heat is transferred between earth and atmosphee. Many of the sums in models are based on informed guesses. ECMWF ensembles use a combination of slightly different data inputs and variations in the model formulation.
 
Last edited:

jdc

Well-known member
Joined
1 Dec 2007
Messages
2,005
Location
Falmouth
Visit site
Prompted by this thread, I looked at the forecast for today where I am in Plockton. Yesterday and indeed in the small hours of this morning (about 1am) the Met Office forecast for 11am today was predicting gusts of 37 kts while the average wind (mean, whatever that means / is defined, or the mode of a distribution?) was 11 kts. EMCWF was predicting same average but gusts of 27. Actually, we had very gentle conditions; the drizzle falling gently and near vertically, and no gusts at all!

There is something wrong with the UKV model or the presentation of its output when a quantitive parameter predicted only 10 hours away can be so grossly wrong. One can postulate that the model is actually broken, but that seems implausible since, apart from gust strength, this week's forecasts have been almost uncannily accurate on all other parameters, and other models do show gusts to be quite high, albeit not as high as the UKV.

So what could be the reason? I surmise that it's a problem with definition rather than models, and the ensemble discussion, although fascinating, is a slight red herring. What exactly does the number given for 'gusts' mean? I don't suppose gusts are direct outputs from the numerical model but are derived from its various outputs or from the distribution of values from multiple runs. So perhaps gusts are now defined as the extreme (6-sigma of the distribution for instance?) limit of what could happen whereas the previous criteria, possibly still used by other agencies, was a value less extreme such as only 2% (say) chance of it being exceeded?

At the moment I just ignore that parameter, but would love to understand more.
 
Last edited:

dunedin

Well-known member
Joined
3 Feb 2004
Messages
13,662
Location
Boat (over winters in) the Clyde
Visit site
Prompted by this thread, I looked at the forecast for today where I am in Plockton. Yesterday and indeed in the small hours of this morning (about 1am) the Met Office forecast for 11am today was predicting gusts of 37 kts while the average wind (mean, whatever that means / is defined, or the mode of a distribution?) was 11 kts. EMCWF was predicting same average but gusts of 27. Actually, we had very gentle conditions; the drizzle falling gently and near vertically, and no gusts at all!

There is something wrong with the UKV model or the presentation of its output when a quantitive parameter predicted only 10 hours away can be so grossly wrong. One can postulate that the model is actually broken, but that seems implausible since, apart from gust strength, this week's forecasts have been almost uncannily accurate on all other parameters, and other models do show gusts to be quite high, albeit not as high as the UKV.

So what could be the reason? I surmise that it's a problem with definition rather than models, and the ensemble discussion, although fascinating, is a slight red herring. What exactly does the number given for 'gusts' mean? I don't suppose gusts are direct outputs from the numerical model but are derived from its various outputs or from the distribution of vales from multiple runs. So perhaps gusts are now defined as the extreme (6-sigma of the distribution for instance?) limit of what could happen whereas the previous criteria, possibly still used by other agencies, was a value less extreme such as only 2% (say) chance of it being exceeded?

At the moment I just ignore that parameter, but would love to understand more.
Yes, that is typically. But I am pretty certain something in the UKHO website gust model changed around July this year, as until then it wasn’t too bad.
Any fool can issue a forecast with average wind 6 mph and gust 30mph (as happened regularly when I first noticed this), and be “right” (as in winds between the bands) 90% of the time. Don’t need a fancy computer model. Just a pre printed laminated card.

But no use to anybody needing a practical forecast of wind strength.
 

franksingleton

Well-known member
Joined
27 Oct 2002
Messages
3,585
Location
UK when not sailing
weather.mailasail.com
My guess is that it is the gust algorithm and not the model itself that is at fault. As I said earlier, models do not predict the “10m” wind. The lowest level in the model is at a height where the pressure is 0.998 x surface pressure. Model levels are all percentages of surface pressure so that models are surface following. The 10m wind is obtained using an algorithm taking surface roughness, stability and wind shear into account. Gust speeds will also be derived using algorithms.

There can be different ideas about algorithms. In the early 2000s, the people using the WW3 wave model used a different algorithm for the 10m wind to that used} by the NOAA people even though they started with the same NWP output. I had a battle with Globalmarinenet about that. That was when I first became aware of the ignorance shown by some third party providers of NWP data.
 

Boathook

Well-known member
Joined
5 Oct 2001
Messages
8,506
Location
Surrey & boat in Dorset.
Visit site
Could it just be for the simple reason that a broader wind forecast covers all bases and lessens criticism ?

I don't know if this is fair or not .

Met Office is rated "Bad" with 1.2 / 5 on Trustpilot
AccuWeather only has a rating of 1.4. Couldn't find the BBC weather listed.
I find that the local BBC TV weather forecasts reasonable 'accurate' to the extent I watch BBC south for the weather and they normally give an idea of the inshore weather as well.

Rather than giving forecasts by a town or village, the Met Office might be better giving it by a geographic area. Years ago at work we had the Met Office sending us emails 3 times a week giving an idea if the expected temperatures to go below freezing and the areas were split geographically. We left it to the Met Office to decide when to stop and start the emails during spring and autumn.
 

franksingleton

Well-known member
Joined
27 Oct 2002
Messages
3,585
Location
UK when not sailing
weather.mailasail.com
I have been around long enough (some would say, far too long) to know that forecast verification is a big bag of nails. Any verification scheme has to be clear about defining what is being assessed and how the assessment is made. It has to be statistically sound. PredictWind has done a much trumpeted assessment using MAE of wind. So, a forecast of W 20 kts with outcomes of N 20, E 20, S 20 would all count as zero errors. At one time, they were claiming that their “proprietary” model, based on a 50 km grid was doing as well as the ECMWF model. I suggested that they should submit their findings for peer review. Not a chance.

The Met Office used to do a “Rain in London” assessment. The senior forecaster had to say YES or NO for tomorrow for there to be measurable rain in London, ie > 0.1mm. On the occasion of a famous storm over Hampstead Heath in the 1950s, the forecasts had been YES. The assessment was against 3 reliable, official, rain gauges at Heathrow, Kew and the then London Weather centre. The forecast was rated wrong as none of these had any measurable rain.

The kind of assessments by Trust Pilot are meaningless. With no disrespect to any of you, I would regard your assertions as similarly meaningless. Just sit back and think how to assess a worded forecast for an area such as NW England. How do you asses global NWP output bearing in mind the smoothing necessary in models. Effective resolutions 50-80 km. Even making an objective assessment of UKV, 1.5 km grid - around 8 km effective resolution, is fraught.

Those running and maintaining NWP models do run routine assessments in order to check the effect of changes in models or drift in performance. Typically, these are RMSVE of wind at 500 hPa, RMSE of the height of the 500 hPa level or of surface pressure. These are assessed against model analyses. The results are useful for the purpose intended. None has any real meaning to us.

My own perception is that the Met Office app, aka UKV, is very good, often to 3 or 4 days ahead. But, I do not have a statistically sound set of data to defend by opinion.

“Weather” is all things to all men and women. There is no way in which forecasts can be produced to suit us all, even if forecasts were 100% correct - whatever that means. NWP output is probably the best chance if every member of the public had an appreciation of predictability and really recognised thst weather is continuously varying in space and time. The target is forever moving. That is, at least, until some observant soul notices a discrepancy between different forecasts.😩😎😳
 
Last edited:

franksingleton

Well-known member
Joined
27 Oct 2002
Messages
3,585
Location
UK when not sailing
weather.mailasail.com
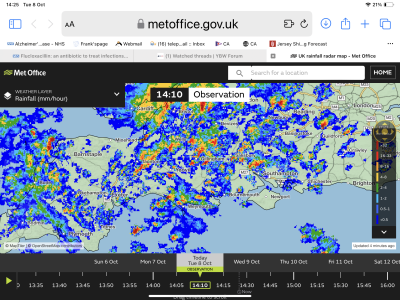
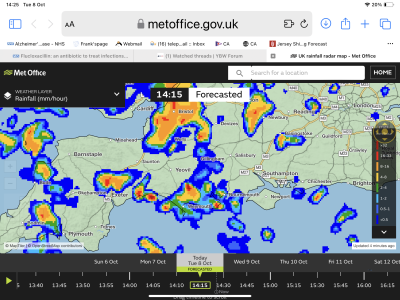
These two images might (or might not) cast a little light on predictability. These are from UK rainfall radar map - Met Office.. Up to “now” images labelled “Observation” are from the British Isles radar network. The spatial resolution is about 1 km.

The “forecasted” images (I cringe at the solecism) are from UKV which calculates on a 1.5 km grid, effective resolution about 8 km. The two images are 10 minutes apart. They show the limitations of even the best detailed forecasts.
 

Attachments

  • IMG_5733.png
    IMG_5733.png
    1.3 MB · Views: 6
  • IMG_5734.png
    IMG_5734.png
    1.3 MB · Views: 6
Last edited:
Top