Refueler
Well-Known Member
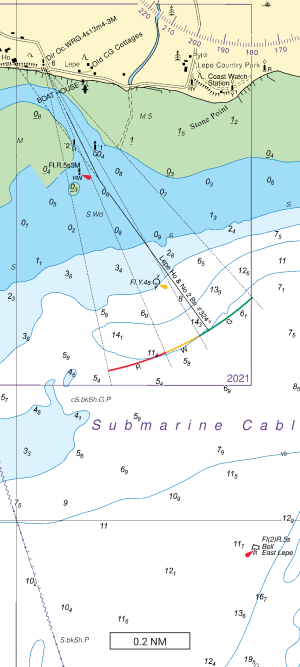
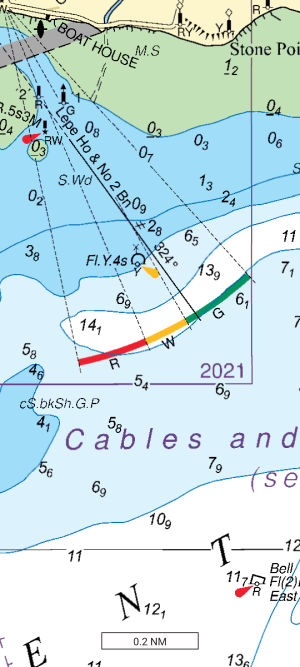
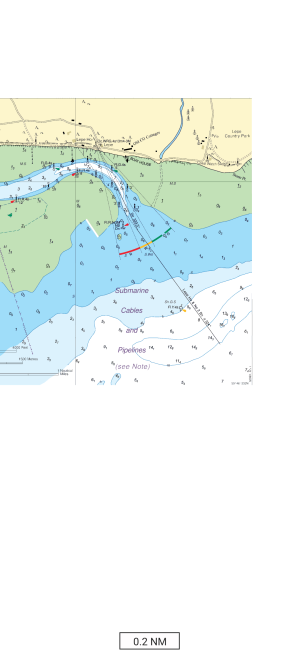
This is a benefit of raster charts - it is a feature and not a bug. When you can see the pixels you know that you're viewing the wrong scale of chart, and you should switch to a larger scale chart.
OpenCPN can automatically change to a more suitable sale of raster chart for you, it works somewhat well, or you can change manually.
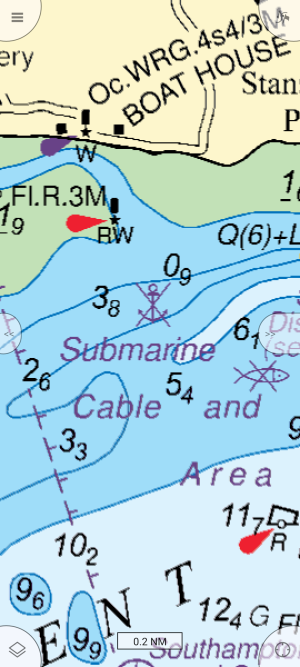
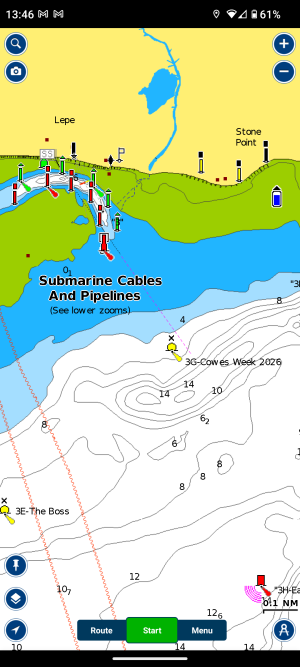
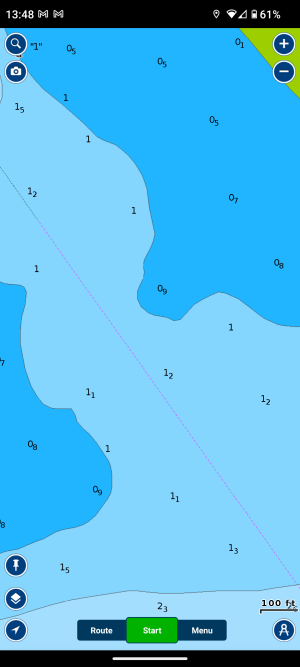
What you say is actually a disadvantage of vector charts - if you zoom in too far using a vector chart then there is nothing to indicate the absent details, you just get a smooth curve and no indicators of rocks, shallows, buoys etc.
Anyone can see this for themselves using NOAA's enc charts of North America - both US2EC02M and US5NC1LP cover the New River at Jacksonville. NC, but the first covers Cape Hatteras to Straits of Florida at 1:1,200,000 scale and the other is at 1:12,000 scale. You can load these up on your PC and the whole of the US east coast is covered at 3 different scales.
There seems to be an attitude on this forum that vector charts are "obviously" better than raster charts, like vector sag files are "obviously" better than jpegs or goes. You only have to look for yourself and see that this is not always the case.
Time to update your views ...
Even UKHO is moving away from Raster.
Raster was based on the digitising of the paper chart archives and UKHO moving towards ECDIS .... UKHO as example moved to digital correction of their charts .. even to no longer carrying physical templates ...
A good chart system - based on an area folio - will auto select seamlessly the next scale detail as you progressively zoom in ... note I am not talking raster .. I am talking vector. The days of just zooming in on one vector chart is old hat ... The base chart stays - but the detail levels change as you zoom in / out. Your argument of vector detail staying without changing is really old hat ...
I have more chart systems than most on these forums ... as I have access to commercial as well as retail.
As to OpenCPN ... mmmm lets be honest - OpenCPN became popular because of the coding for CM93v2 becoming common knowledge and being integrated into OpenCPN. Now people could have worldwide coverage free of charge. To quote OpenCPN for Raster - I accept - but also must comment that I reckon most users are still using CM93v2 ... which stopped being updated about 2015~ .... and even that is questionable .. as CM93v3 was already delivered ...
But of course v3 - OpenCPN cannot use.
There are better chart programs out there than OpenCPN ! Some even can use CM93v3 ..... I will not answer here or via PM the program links / names due to Licence restrictions.

