BelleSerene
Well-Known Member
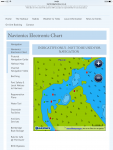
Navionics' 'SonarChart', the bathymetry crowd-sourced from your and my depth sounders as we traverse the seas and data-cleansed by some algorithm somewhere, is brilliant. Turn it on in their online web app, or download it to your chart plotter as an optional layer of information, and you have much more accurate and much more up-to-date depth information than you can get from any chart.
But. For some reason that beats me, they turn it off over drying features - the green areas on your chart. So once you're in shallower water than the chart datum contour, SonarChart gives you no information at all.
Why on earth would they blank out depth information that boats have experienced above the drying contour?!
")