Middie H.
Member
Hello guys
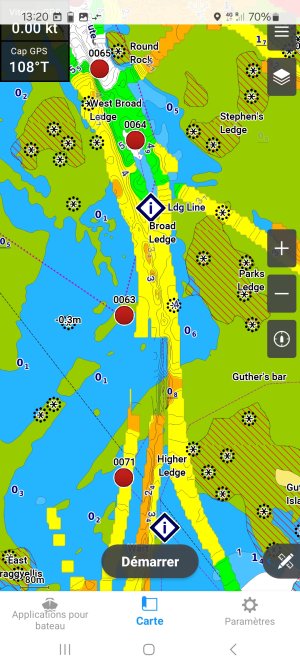
We are using Navionics sea chart with Zeus II chart plotter. We have renewed our licence a month ago and tested it at home, it worked nicely. Now, heading to Borkum (DE) via Delfzijl (NL), the chart shows weird yellow patches instead of blue colours which indicate water depth.
Have someone had also this problem?
Thanks
Middie

")


