C-Map or Navionics?

Arcady

Active member
Joined
9 Dec 2010
Messages
643
Location
Guernsey
Visit site
Having just opted for B&G Zuess MFDs, I’m now debating whether to opt for C-Map or Navionics charts. I have experience of both, but on systems 15-20 yrs old. Both seemed equally good to me.

I’m curious: What’s the verdict on current offerings?

Disclaimer: I fully expect this discussion to be as opinionated as a typical anchor thread … :)
 

KompetentKrew

Well-known member
Joined
27 May 2018
Messages
2,454
Visit site
A couple of years ago I did a comparison between the two, complete with animated gifs: Comparison of Navionics and C-Map for B&G Vulcan.

I don't think it's anything more than personal preference, and I slightly prefer C-Map - the most tangible reason I can give is that C-Map shows tidal flows better.

I was surprised to find that the icons they use for lateral marks etc are slightly different, on the same plotter.

Also, a detail shown at one zoom level on one brand's digital cartography might require an additional level of zoom before it is revealed on the other - this seems potentially more significant, but I can't say I noticed any problem in practice; perhaps this is because of how readily one zooms in and out on a chart plotter.
 
Last edited:

Arcady

Active member
Joined
9 Dec 2010
Messages
643
Location
Guernsey
Visit site
Daverw: Good point: I have Navionics on IPhone + an Android tablet. Commonality of system would be a big plus.

KompetentKrew: thanks for the link to your most helpful comparison
 

lustyd

Well-known member
Joined
27 Jul 2010
Messages
12,503
Visit site
I have both on a Vulcan 9/Zeus 3s 9 setup. On the plotter with the standard charts they are indistinguishable. I prefer the tides on Navionics but can't really quantify why.
Navionics updates more often
Navionics has the advantage of sonar charts which are much higher resolution in popular areas and show more recent depth soundings since they come from users of the app. These are optional, so I suggest ignoring those telling you they aren't accurate since it's irrelevant.
Navionics has a better app in every concievable way. CMAP are slowly copying it, but seem to be using interns to do so with no coding experience and no interface design knowledge.

I can't think of a single advantage of CMAP. There's nothing wrong with them, but the peripheral software and community is just better with Navionics.
 

Roberto

Well-known member
Joined
20 Jul 2001
Messages
5,423
Location
Lorient/Paris
sybrancaleone.blogspot.com
I’m curious: What’s the verdict on current offerings?
Disclaimer: I fully expect this discussion to be as opinionated as a typical anchor thread … :)
Not sure there is a verdict, to get a more technical insight into electronic charting for non-commercial boats download this booklet and make up your own mind
https://rin.org.uk/page/ENav

Also, consider this list (from the same RIN) and how your different electronic chart providers check against each of the points they highlight. Some are very close to zero.
Make your own idea about what different brands of leisure yachting electronic charting can offer and what theyy can not, then choose by yourself :)

Excerpt from this link
https://rin.org.uk/page/ENavRec


Recommendations for official bodies, developers and manufacturers to improve eNavigation systems towards compliance with SOLAS V on leisure vessels

[...]

The simple question the consumer should be able to ask of the chart/chart-plotter vendor would be "Does this accord to the RIN standards?” Experience shows that where standards have been enforced against the wishes of the commercial sector, life has improved for both customers and manufacturers/suppliers e.g. think USB ‘phone chargers or ‘phone roaming costs.

1 Chart data, presentation and software:
1.1 Leisure chart suppliers and IHO must agree some key standards for both the chart data and the operating systems for approved use on small vessels (pleasure and commercial). ECDIS provides a good example of how common standards, manufacturer independent, could underpin electronic leisure charts and systems if driven by regulators and/or commercial pressure.
1.2 It would be beneficial to leisure chart users if standard categories of accuracy (equivalent to zones of confidence) could be available to be presented in some simple way on electronic leisure charts. It should be user-configurable such that it could be turned on/off easily to reduce clutter.
1.3 In the same way, the date of the survey should be easily available, for example, at the beginning of a session, when the vessel crosses a category of accuracy boundary or by interrogating the chart.
1.4 Recent changes to CD in the Baltic have highlighted the importance of Chart Datum information being clearly presented on electronic charts at the start of that chart’s use.
1.5 Sufficient coastal topographical features should be displayed on all leisure charts to allow bearings to be taken.
1.6 An agreed standard presentation/standardised set of symbols across all leisure charts, conforming to IHO symbols.
1.7 There should be a clear indication when the zoom level is inappropriate for the available data (“overzooming”).
1.8 The date the chart was last updated in the installed card/memory should be clearly displayed at start-up. If the system is aware that updates are available the length overdue should also be displayed.
1.9 The ability of vector charts to ‘hide’ information, depending on levels of zoom, needs to be constrained (see Team Vestas Wind report*) e.g. shoals or TSSs. Standards of display can and should use the best features of both RASTER and vector charts. In particular, any area zoomed out should always show, and be coloured according to, the lowest depth (or highest drying height) within the area summarised to a smaller scale – i.e. to show any danger present which would be visible at a higher scale/level of zoom. *
1.10 Consideration could be given to the obliteration of all data below, say, 20 metres, apart from major contour lines, on leisure charts (if it saves production cost and memory).

2 Chart Display Systems (hardware):
2.1 All chart display systems should have a simple method of supporting chart data and software updates, ideally via direct downloads or downloads to a card for insertion in the equipment. These can and should be inexpensive and extend to legacy systems where possible. The update status of all the installed charts should be available through the system menus.
2.2 An agreed selection of key functions should be standardised across all leisure chart display systems. Possibly including an “S” mode button which would access a standard basic function menu and setup.
2.3 The ability to plot bearings easily on charted features in order to create position fixes is considered essential as a backup in case of loss of GNSS fix.
2.4 Verification of quality of the GNSS fix should be available and intuitively presented (NB HDoP values may not be understood by all users), for example a coloured dot at the corner of the screen.
2.5 If the system can operate in DR mode and is so doing (no GNSS fix) then this should be clearly shown on the screen.
2.6 It should be clear to the user, at all times, whether chart display systems are online only. Charts for navigational use should be installed on the device, not reliant on data transfer, and there should be clear differentiation – potential misunderstandings arise where ‘passage planning’ info suddenly becomes inaccessible at sea.

3 New Technology:
3.1 All 3 GLAs should consider extending the trial Irish Lights MetOcean data provision as it is a very useful source of near real-time local weather information for small craft users.
3.2 Manufacturers should consider how the GLA ePelorus system could be standardised in leisure systems either via an electronic hand-bearing compass or binoculars to enable the rapid addition of bearing lines to the electronic chart.
 

KompetentKrew

Well-known member
Joined
27 May 2018
Messages
2,454
Visit site
Cmap have stopped updating charts on my cmap nt+ cards.
That looks like an older format - I wouldn't be surprised if your plotter is 15 years old. That's not long in boat years, but it's ancient in electronics years.

Do Navionics still offer cartography on this card type?
 

Laysula

Well-known member
Joined
1 Jun 2008
Messages
2,443
Location
Brixham
www.stevehuntdrivinginstructor.co.uk
That looks like an older format - I wouldn't be surprised if your plotter is 15 years old. That's not long in boat years, but it's ancient in electronics years.

Do Navionics still offer cartography on this card type?
Yep. It's an Raymarine RL70c plotter and radar. Getting on a bit but still in as new condition and working perfectly. Shame really. Up for sale if anyone wants it with charts for South coast North France, Atlantic France and North Spain.
 

Arcady

Active member
Joined
9 Dec 2010
Messages
643
Location
Guernsey
Visit site
That looks like an older format - I wouldn't be surprised if your plotter is 15 years old. That's not long in boat years, but it's ancient in electronics years.

Do Navionics still offer cartography on this card type?

Coincidentally I see that sailorbenji currently has some for sale
 

Arcady

Active member
Joined
9 Dec 2010
Messages
643
Location
Guernsey
Visit site
Do C-Map still not give drying heights on the green bits? They used not to.

Follow the link in post 3 (KompetentKrew) and you will see screen comparisons where C-Map appear better than Navionics in that respect. I am leaning towards Navionics but that one aspect is a plus for C-Map as far as I’m concerned.
 

lustyd

Well-known member
Joined
27 Jul 2010
Messages
12,503
Visit site
Do C-Map still not give drying heights on the green bits? They used not to.
Both are rendered by the plotter since both are vector charts. The information is there on both and for all intents and purposes could be displayed identically. See the recent vector vs raster thread for all the wild misconceptions in this area!
 

AngusMcDoon

Well-known member
Joined
20 Oct 2004
Messages
8,832
Location
Up some Hebridean loch
Visit site
Follow the link in post 3 (KompetentKrew) and you will see screen comparisons where C-Map appear better than Navionics in that respect. I am leaning towards Navionics but that one aspect is a plus for C-Map as far as I’m concerned.

Thanks. That shows that drying heights data are present in current C-Map. Years ago I was one of the contributing developers of OpenCPN and I could see then that my (admittedly old) C-Map data did not have drying heights at the time.
 
Last edited:

Roberto

Well-known member
Joined
20 Jul 2001
Messages
5,423
Location
Lorient/Paris
sybrancaleone.blogspot.com
drying heights
If anyone is interested in drying areas, I'd be particularly careful with Sonar charts
This is (was, it has been corrected since) a Sonar chart for a very crowded area
glen2.JPG


this is the HO chart
glen shom.JPG

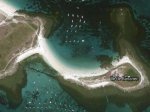
and GE
glenGE.jpg

Sonar charts integrated crowd source data without making any depth reductions to datum: the area between the two islets dries, obviously boats can cross over there only with a sufficiently high tide, no "crowd sourced" data of drying heights, Sonar chart simply took the user depths without making any corrections for the state of the tide.
Someone signaled this to Navionics and they removed it, reverting to a chart version identical to SHOM data, which incidentally they did in a number of other areas with similar errors. One has to hope such errors have been signalled everywhere in tidal areas :)
 

lustyd

Well-known member
Joined
27 Jul 2010
Messages
12,503
Visit site
So you reported an error and they fixed it? I feel like all chart companies have similar stories. You do need to remember that the sonar chart overlay is an optional extra not available elsewhere, you still get the standard chart and you still have a depth sounder and eyes. If there's sand ahead, back off of the throttle :D
 

Arcady

Active member
Joined
9 Dec 2010
Messages
643
Location
Guernsey
Visit site
If anyone is interested in drying areas, I'd be particularly careful with Sonar charts
This is (was, it has been corrected since) a Sonar chart for a very crowded area
View attachment 129633


this is the HO chart
View attachment 129634

and GE
View attachment 129635

Sonar charts integrated crowd source data without making any depth reductions to datum: the area between the two islets dries, obviously boats can cross over there only with a sufficiently high tide, no "crowd sourced" data of drying heights, Sonar chart simply took the user depths without making any corrections for the state of the tide.
Someone signaled this to Navionics and they removed it, reverting to a chart version identical to SHOM data, which incidentally they did in a number of other areas with similar errors. One has to hope such errors have been signalled everywhere in tidal areas :)

Wow - that's some discrepancy. As an ex hydrographic surveyor (long time ago) I have watched the increasing use of user data with interest. Modern integrated nav systems can deliver everything the hydrographer needs for accurate, reduced soundings: position, date, time, depth. Navionics has access to the local tide predictions (granted not necessarily as accurate as actual tide recordings) with which to reduce the soundings. I find it hard to believe that user data is not automatically processed in this way before incorporating it into their sonar charts. One can only assume (hopefully) that the example above is an atypical mistake.
 

Arcady

Active member
Joined
9 Dec 2010
Messages
643
Location
Guernsey
Visit site
A further thought: maybe Navionics did go through the automatic reduction process with erroneous data. What I don't know enough about is what happens if the user has the wrong date/time set on their nav system. Is it possible to do this and still collect Sonarchart data?
 
Top