Always trust your charts???

tillergirl

Well-known member
Joined
5 Nov 2002
Messages
8,536
Location
West Mersea
Visit site
That’s one of the real issues with all (AFAIK) leisure electronic vector charts - Navionics, C-Map, Lighthouse et al - is that they don’t show you the sources (survey date, CATZOC etc) to allow you to see how confident the chart maker was.
This is one of the specific concerns raised with leisure chart publishers by the RIN and the Cruising Association.
Plenty of areas in Scotland with very old survey dates - or simply still unsurveyed.

That is one of the critical issues. No electronic leisure chart shows the sources and that is a real danger. Many modern sailors assume charts are 'up to date' often as they are said to be. 'Up to date' means reying on the latest data. I thought to monitor Navionics and C-Map in respect of several Notices to Mariners in the Thames Estuary. Navionics took 3 months to respond, C-Map longer. By saying 'respond' I meant completing the changes. In fact Navionics did act on the soundings after a month but didn't alter the contours until 3 months. Which rather made a pig's ear. There is one area that Navionics hasn't bothered to update the chart for at least 5 years and still doesn't display a buoy and still doesn't address the contours. C-Map in the same area has all the buoys and the contours are right and has even updated the depths. Imray have as well. (I have Navionics, C-Map and Imray).
 

Minerva

Well-known member
Joined
16 Oct 2019
Messages
1,360
Visit site
No, they add any sort of data that has no relationship with actual surveys.
I won't copy all the images again, take a tour with their "webapp" to North Korea, flooded areas of Bangladesh, Cape Horn island, Canadian sea area usually covered by ice etc etc all of these show contours with 50cm spacing... who in his right mind might think that corresponds to reality? Re Sonar charts, they also show them for North Korea, notoriously full of local anglers sending their user data to Navionics/Garmin US, or Cape Horn, where apparently a lot of people turn around the island sending depths to them.
I'll remember not to use Navionics next time I'm cruising North Korea!
 

Frank Holden

Well-known member
Joined
23 Nov 2009
Messages
1,125
Location
Cruising in the Golfo Corcovado
Visit site
What I would like to see on all electronic charts would be an inability to 'over zoom'.
The OPs screen shot looks well and truly over zoomed to me.

Back in the old fashioned days of paper charts a rule of thumb that worked for me was 'never get closer than one inch to any dangers - regardless of the chart scale'. Seemed to work.
 

Frank Holden

Well-known member
Joined
23 Nov 2009
Messages
1,125
Location
Cruising in the Golfo Corcovado
Visit site
That might rule out visiting much of Scotland, Norway and Sweden :)
And also Patagonia - unless you have the Chart Atlas with the far more detailed charts and even then you don't expect the GPS L/L to match up with the charted L/L .

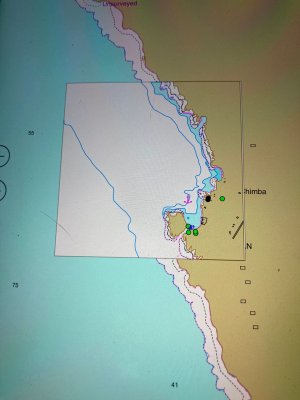
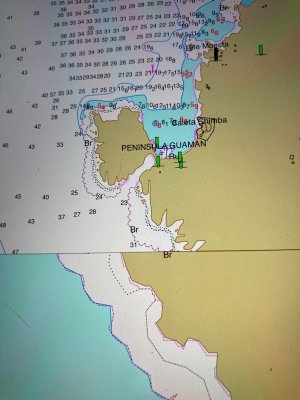
Example of how iSailor deals with it . First shot you can see that there is a more detailed chart covering Caleta Chimba, zoom in ( second shot) and you see the more detailed chart information - just like pulling a larger scale chart out of the chart table drawer.
I would enter the caleta with confidence -up to the 10metre line- using that info, close south I would stay well offshore. Note, this is northern Chile , L/L up there is pretty good on large scale charts. IMG_3283.jpegIMG_3285.jpeg
 

john_morris_uk

Well-known member
Joined
3 Jul 2002
Messages
27,893
Location
At sea somewhere.
yachtserendipity.wordpress.com
What I would like to see on all electronic charts would be an inability to 'over zoom'.
The OPs screen shot looks well and truly over zoomed to me.

Back in the old fashioned days of paper charts a rule of thumb that worked for me was 'never get closer than one inch to any dangers - regardless of the chart scale'. Seemed to work.
I completely agree re the over zooming but I wasn’t trying to make that point. At any scale, the electronic charting was wrong. As it happens I’ve also got the large scale UKHO chart of that bay as well and it’s no better.

It’s the survey that’s out of date (whoever did it!) and as far as I am concerned my screen shot was trying to demonstrate that.
 

Bajansailor

Well-known member
Joined
27 Dec 2004
Messages
6,495
Location
Marine Surveyor in Barbados
Visit site
Re the 'Roundabout Reef', I am guessing that you are still anchored in Clifton Harbour at Union Island?
We have never bothered with charts when sailing in the Grenadines in the past (apart from general reference), as we knew that they were so inaccurate - eyeball navigation, with the sun fairly high is much more reliable.
Is Happy Island on the windward reef still in operation? If so, I hope you had a drink or two in the wee bar there. Last time I was there (some years ago now), the kite surfers were jumping their boards over the island....... :)
 

john_morris_uk

Well-known member
Joined
3 Jul 2002
Messages
27,893
Location
At sea somewhere.
yachtserendipity.wordpress.com
Re the 'Roundabout Reef', I am guessing that you are still anchored in Clifton Harbour at Union Island?
We have never bothered with charts when sailing in the Grenadines in the past (apart from general reference), as we knew that they were so inaccurate - eyeball navigation, with the sun fairly high is much more reliable.
Is Happy Island on the windward reef still in operation? If so, I hope you had a drink or two in the wee bar there. Last time I was there (some years ago now), the kite surfers were jumping their boards over the island....... :)
Not sure if Happy Island was running or not. We didn’t have time to visit as we need to be in Grenada Marine by this evening. Our brand new Whisperpower generator managed to break a pushrod and Grenada Marine are main agents and are repairing it under warranty. (It took a while to get a new pushrod sent from the manufacturer in Netherlands. ) We’re currently in Tyrell Bay, Carriacou and heading S in a couple of hours.

Understood re eyeball navigation. It’s probably lack of experience but one problem is that when the waters really clear it’s difficult to tell the difference between 10 metres 5 metres and 2 metres depth.

It’s very much quieter than even just a few weeks ago. Places closing and far fewer yachts around. Boatyards filling up and anchorage’s comparatively empty.
 

Whaup367

Active member
Joined
1 Sep 2022
Messages
231
Visit site
That’s one of the real issues with all (AFAIK) leisure electronic vector charts - Navionics, C-Map, Lighthouse et al - is that they don’t show you the sources (survey date, CATZOC etc) to allow you to see how confident the chart maker was.
This is one of the specific concerns raised with leisure chart publishers by the RIN and the Cruising Association.
Plenty of areas in Scotland with very old survey dates - or simply still unsurveyed.

Dragging up an old(ish) thread after searching for info on this topic (and prompted by the recent discussions on getting Antares onto a chartplotter which I understand would be a challenge): Is there a way to get survey dates displayed on a chartplotter?

Looking at UKHO charts for Loch Mariveg (for example), I see that the survey dates for Stornoway are reasonably current but those for Loch Mariveg are mid-19th century. AFAICT, there's no way to tell, if I'm using Navionics, that the data is "old".

Is there an affordable way to get UKHO charts (or another supplier that includes this info; does Imray raster digital include it?) onto a chartplotter, so that we know when we need to reach for the tablet?
 

dunedin

Well-known member
Joined
3 Feb 2004
Messages
14,039
Location
Boat (over winters in) the Clyde
Visit site
Dragging up an old(ish) thread after searching for info on this topic (and prompted by the recent discussions on getting Antares onto a chartplotter which I understand would be a challenge): Is there a way to get survey dates displayed on a chartplotter?

Looking at UKHO charts for Loch Mariveg (for example), I see that the survey dates for Stornoway are reasonably current but those for Loch Mariveg are mid-19th century. AFAICT, there's no way to tell, if I'm using Navionics, that the data is "old".

Is there an affordable way to get UKHO charts (or another supplier that includes this info; does Imray raster digital include it?) onto a chartplotter, so that we know when we need to reach for the tablet?
Just replied to your similar question on the other thread.
In short, on a typical yacht MFD/chart plotter - NO I don’t believe you can currently see chart sources / levels of confidence (CATZOC).
The only way is raster charts on an app, and that isn’t always easy.

It is very relevant - as I am discussing with UKHO a large area of drying rocks entirely missing from UKHO charts in Scotland (and hence proudly showing safe 5m depth on Navionics, who use UKHO data, whereas a large area is drying) - this is shown as on old survey and low confidence level on the relevant paper chart, but no way of knowing this from my Navionics chart on Raymarine MFD.
 

john_morris_uk

Well-known member
Joined
3 Jul 2002
Messages
27,893
Location
At sea somewhere.
yachtserendipity.wordpress.com
Interesting.

Many organisations are contributing to data used by Navionics to build their “sonar charts”.

Acknowledgements

Navionics using an algorithm to interpolate between soundings is no different to a depth contour drawn on a paper chart by a hydrographic office.

The risk of interpolation is part of the RYA syllabus (or was on my Day Skipper shore based). The diagram of the unsounded rock between soundings is common in text books, usually associated with a lesson on the source chart. There is no reason to assume Navionics is any more accurate because they show more contours. Navionics though leverage the density of soundings on their charts for marketing purposes suggesting it gives an advantage. It is also clear that modern leisure based sonar systems are providing a lot of data.

Its not just a case of leisure users sonar data being shared. There are EU, USA and other country agencies established to share sonar from different sources and make it available.

Never mind the quality, feel the width.
As the thread has been resurrected I’ve read through it and there are a couple of comments I want to make.
Your comment re the contours on a UKHO chart being no better than the made up by algorithm of the Navionics charts isn’t true. On the UKHO chart, the contour will have been surveyed with some care if it’s a solid line. If they’ve interpolated then they draw a pecked line to show it’s their best guess.

As John Goode (RIP) told me once, ‘It’s one of the reasons why the charts are so expensive’!
 

john_morris_uk

Well-known member
Joined
3 Jul 2002
Messages
27,893
Location
At sea somewhere.
yachtserendipity.wordpress.com
Used to go the UKHO quarterly as a rep on a liason group. Fascinating to talk to them about chart accuracy. OK this was some time ago when they were first going through the process of redrawing charts to WGS 84 but in doing so they had found areas of the UK that were as much as 5 miles adrift on the then current charts - errors that only became obvious with satellite data. They also revealed that they were now using foreign state data as the base for foreign countries rather than the previous RN data where available. So some of the source data for small foreign locations might not be quite the quality you expect.
As I said this was some years ago but I wouldnt see chart data as absolutely accurate even now. How much of the UK coastal waters has for example been surveyed fully with modern survey kit? Most tidal flow data is interpolation between a small number of points
The use of foreign data for inshore waters is not a new phenomenon. If an RN surveying ship was caught surveying in another countries territorial waters it could be construed as an act of war.
 

dunedin

Well-known member
Joined
3 Feb 2004
Messages
14,039
Location
Boat (over winters in) the Clyde
Visit site
Yeah, but you've got Antares Charts in Scotland - you can get into some seriously tight, scary (but magnificent) places with those.
Your quoting my reply is completely out of context without the comment I was replying to - a poster said “never get closer than one inch to any dangers - regardless of the chart scale”.
Not sure that there is an easy concept of an “inch” on a zoomable raster chart like Antares that isn’t published on paper - but you are rarely far from a rock or other hazard :cool:
 

RunAgroundHard

Well-known member
Joined
20 Aug 2022
Messages
2,318
Visit site
… Your comment re the contours on a UKHO chart being no better than the made up by algorithm of the Navionics charts isn’t true. On the UKHO chart, the contour will have been surveyed with some care if it’s a solid line. If they’ve interpolated then they draw a pecked line to show it’s their best guess. …

I disagree. It is stated that there may be features between contours (which I also interpret as along contours), which the survey may not have detected. Of course that point is more relevant to lead line soundings, than sonar, but even sonar is not uniform over every square mm of seabed.

Your confidence is misplaced on charts with older surveys. I agree that modern surveys will be be more accurate by a significant margin.

I can give examples, as I update my charts, however I can’t currently quote correction or chart. There is a lot of recent surveys being performed by private contracted, organisations, fish farms, wind farms. A few rocks and contours, WCoS, have been moved, I assume because the earlier surveys, by UKHO were not that accurate.
 
Top