The Knoll

tillergirl

Well-known member
Joined
5 Nov 2002
Messages
8,452
Location
West Mersea
Visit site
Many of you will remember that Larry (aka Gladys) and I had prompted a 'Less water reported 2024' at the Knoll in the Weeks 37 and 38 Notices to Mariners Part 1 thread - well over 500 have looked at the thread! 👍 We had found 'less water' while we were doing a rather unsuccessful experiment over the Knoll back in August and so as a result we went back there on Saturday 7th September. Conditions were perfect; probably the flatest day we have ever experienced so we collected data for over 4 hours. Bizarrely having finished we suffered a complete comfuter (sic) crash. Actually I suffered it but Larry had to ensure the silence on the way back while I lost over 10080 data lines with the permanent lose of not only the primary but also the back-up. 😢 BUT! 😁 It turned out that I had a second back-up system: cost a few squids for a new bit of software but we retrieved the data; indeed instead of lost 10080 data lines, we had 70787 data lines of data! That was typically a ping every 2ft of 23 n miles or so. Never knew that a second back-up system existed. 😵‍💫

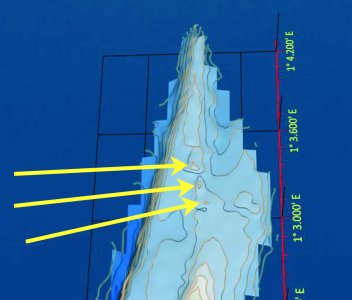
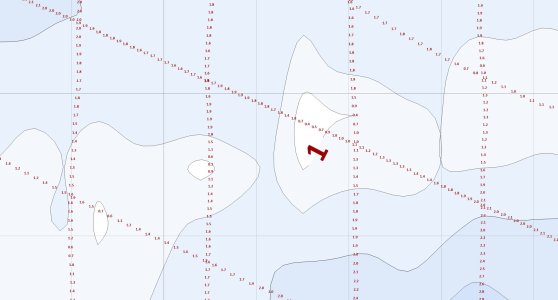
I'll get to the point: whilst the overal footprint of the Knoll remains constant, the drying area has moved and increased in size within the overal footprint. The NW Knoll PHB remains in the right place. For those unfamiliar, the Knoll is on the south side of the entrance to the River Blackwater (the SHBs are the Eagle and Bench Head) and there is a tendancy for some to 'straight line' from the Spitway to the Blackwater and pass on the wrong side of the NW Knoll (we do!). On the day we were there, two motor boats passed over the shallow parts of the Knoll or v. close by at full speed so we reflected if they had considered the height of tide. Prior to the 7th September, the latest data available to the UKHO was 1985 which does rather underline the value of checking the source data - but unfortunately it is only available on standard UKHO charts. Checking back on old charts, the drying area in 1903 were identical to today; in 1940, much smaller and a little to the west. Which will tell us that the drying area will move over the years. On a lively day, a spring tide will agitate the waters around and over the Knoll and would be well worth avoiding even if there is plenty of height of tide.

The data has gone to the UKHO and I understand the plan is to provide a NtM for Chart 3741 (Rivers Colne and Blackwater) and for Chart 1975 (Thames Estuary - Northern Part) to incorporate the data in time for the next edition which is expected early next year. There is a CTTE chartlet available (third item) at: Downloads. Click the download button for the pdf files, click on the image for the jpeg. Not the most critical place but we hope it helps. :)
 

tillergirl

Well-known member
Joined
5 Nov 2002
Messages
8,452
Location
West Mersea
Visit site
Are the "ripples" along the northern slope real, or are they artefacts of the line spacing? It would be nice to see a plot with the survey tracks superimposed.
I am re-starting this response for the third time as the more I revert back to the data, the data changes my mind! The fact is, there is so much data and so much to consider it needs quite a bit of investigation before it can be said 'they are artefacts' or 'they are ripples'. Send me a pm with your email and I can send you a relevant plot. I am sure that there are 'artefacts' but some that are suspected might not be. But I am sure there is some 'peaking'. I ought explain 'peaking' to others. This is where the chart suggests an isolated peak or a series of isolated peaks along a ridge. Now we were using SBES - single beam echo sounding so we get a single line of soundings in our wake. If (we had a fortune) we had MBES - multi-beam - we would be collection a swathe of soundings either side of us. When I see some peaks such as the Knoll in the extract attached Igo back to the individual soundings. I see there is evidence of peaks but the software considers adjacent peaks has insufficient data to connect them - see the second image (I hope this is legible). At the Ray Sand there were similar issues and we went back down there to try to run along the top of the ridge - that's pretty difficult but we connected the peaks.

So trying to illustrate the data can cause problems. On those peaks, if I look at the side scan there is strong support that the peaks are no isolated peaks but a ridge, perhaps caused by a fault in the underlying seabed.

It may be that another gridding method can improve the product: I am using Kriging and there are alternatives built into the software. Also there are alternatives in Kriging. The manual refers to Point Kriging and Block Kriging and there are references for some serious reading. I need to check to be sure that I had used the set-up to best advantage.

There is so much to think about but a point about Dan's comment. Yes the kit is very clever and can be impressive. But consider Irving and Coote who produced brilliant chartlets with lead and tallow. They were impressive. Not only did they collect the data but they worked out where they were!

Send me a pm AP
 

Attachments

  • Peaking.jpg
    Peaking.jpg
    556.4 KB · Views: 17
  • Peaking 2.jpg
    Peaking 2.jpg
    135.3 KB · Views: 15

AntarcticPilot

Well-known member
Joined
4 May 2007
Messages
10,382
Location
Cambridge, UK
www.cooperandyau.co.uk
I am re-starting this response for the third time as the more I revert back to the data, the data changes my mind! The fact is, there is so much data and so much to consider it needs quite a bit of investigation before it can be said 'they are artefacts' or 'they are ripples'. Send me a pm with your email and I can send you a relevant plot. I am sure that there are 'artefacts' but some that are suspected might not be. But I am sure there is some 'peaking'. I ought explain 'peaking' to others. This is where the chart suggests an isolated peak or a series of isolated peaks along a ridge. Now we were using SBES - single beam echo sounding so we get a single line of soundings in our wake. If (we had a fortune) we had MBES - multi-beam - we would be collection a swathe of soundings either side of us. When I see some peaks such as the Knoll in the extract attached Igo back to the individual soundings. I see there is evidence of peaks but the software considers adjacent peaks has insufficient data to connect them - see the second image (I hope this is legible). At the Ray Sand there were similar issues and we went back down there to try to run along the top of the ridge - that's pretty difficult but we connected the peaks.

So trying to illustrate the data can cause problems. On those peaks, if I look at the side scan there is strong support that the peaks are no isolated peaks but a ridge, perhaps caused by a fault in the underlying seabed.

It may be that another gridding method can improve the product: I am using Kriging and there are alternatives built into the software. Also there are alternatives in Kriging. The manual refers to Point Kriging and Block Kriging and there are references for some serious reading. I need to check to be sure that I had used the set-up to best advantage.

There is so much to think about but a point about Dan's comment. Yes the kit is very clever and can be impressive. But consider Irving and Coote who produced brilliant chartlets with lead and tallow. They were impressive. Not only did they collect the data but they worked out where they were!

Send me a pm AP
I've PM'd you my email address.

Does your software include ANUDEM? That's what I always preferred for topographic surfaces. You have to be careful about using the right options for this application - if you don't get it right it generates spurious river channels, but it does generate surfaces that respect geomorphology better than purely analytical techniques do.
 

Jan Harber

Active member
Joined
8 Nov 2009
Messages
295
Visit site
I am re-starting this response for the third time as the more I revert back to the data, the data changes my mind! The fact is, there is so much data and so much to consider it needs quite a bit of investigation before it can be said 'they are artefacts' or 'they are ripples'. Send me a pm with your email and I can send you a relevant plot. I am sure that there are 'artefacts' but some that are suspected might not be. But I am sure there is some 'peaking'. I ought explain 'peaking' to others. This is where the chart suggests an isolated peak or a series of isolated peaks along a ridge. Now we were using SBES - single beam echo sounding so we get a single line of soundings in our wake. If (we had a fortune) we had MBES - multi-beam - we would be collection a swathe of soundings either side of us. When I see some peaks such as the Knoll in the extract attached Igo back to the individual soundings. I see there is evidence of peaks but the software considers adjacent peaks has insufficient data to connect them - see the second image (I hope this is legible). At the Ray Sand there were similar issues and we went back down there to try to run along the top of the ridge - that's pretty difficult but we connected the peaks.

So trying to illustrate the data can cause problems. On those peaks, if I look at the side scan there is strong support that the peaks are no isolated peaks but a ridge, perhaps caused by a fault in the underlying seabed.

It may be that another gridding method can improve the product: I am using Kriging and there are alternatives built into the software. Also there are alternatives in Kriging. The manual refers to Point Kriging and Block Kriging and there are references for some serious reading. I need to check to be sure that I had used the set-up to best advantage.

There is so much to think about but a point about Dan's comment. Yes the kit is very clever and can be impressive. But consider Irving and Coote who produced brilliant chartlets with lead and tallow. They were impressive. Not only did they collect the data but they worked out where they were!

Send me a pm AP
The modern technology is amazing. Thank you Roger, for putting it to such good use.
My dad would have been chuffed to find himself included, alongside Irving, in your praise. He certainly did use a lead line in those early days of fathoms and feet. I should know, as I was often the one with wet and muddy sleeves.
After moving on to echo sounders and also into metric, Jack continued, with the help of his friend Norman Wynn and his fast motorboat White Dolphin, to take soundings and collect data. They regularly checked the Raysand Channel and the Swin Spitway.
Cdr John Pryor was an unsung hero who, after his retirement from being an RN Hydrographer, surveyed the Ore entrance for many years. His findings were published annually by the Alde and Ore Association.
I think they would all have been impressed by the latest kit and what can be done with it.
 

ex-Gladys

Well-known member
Joined
29 Aug 2003
Messages
5,218
Location
Colchester, Essex
Visit site
The modern technology is amazing. Thank you Roger, for putting it to such good use.
My dad would have been chuffed to find himself included, alongside Irving, in your praise. He certainly did use a lead line in those early days of fathoms and feet. I should know, as I was often the one with wet and muddy sleeves.
After moving on to echo sounders and also into metric, Jack continued, with the help of his friend Norman Wynn and his fast motorboat White Dolphin, to take soundings and collect data. They regularly checked the Raysand Channel and the Swin Spitway.
Cdr John Pryor was an unsung hero who, after his retirement from being an RN Hydrographer, surveyed the Ore entrance for many years. His findings were published annually by the Alde and Ore Association.
I think they would all have been impressed by the latest kit and what can be done with it.
Oh,but the nagging from the right hand seat when we're trying to do a 150 m turn between runs on the grid! I need to work on the technology to instantaneously reposition the survey vessel 150m away on a reciprocal course...

We were both very frustrated when TG identified the data wasn't being logged on the laptop, but the upshot is turning Roger upside down and shaking him hard resulted in enough shekels to pay for the software to extract data from the Humminbird recording. As you can imagine there is quite a lot of email correspondence between the Captain and the Deckhand...
 

DanTribe

Well-known member
Joined
8 Jan 2002
Messages
5,402
Location
Essex
Visit site
Oh,but the nagging from the right hand seat when we're trying to do a 150 m turn between runs on the grid! I need to work on the technology to instantaneously reposition the survey vessel 150m away on a reciprocal course...

We were both very frustrated when TG identified the data wasn't being logged on the laptop, but the upshot is turning Roger upside down and shaking him hard resulted in enough shekels to pay for the software to extract data from the Humminbird recording. As you can imagine there is quite a lot of email correspondence between the Captain and the Deckhand...
Oh please don't disillusion us with the sordid details.
I thought it was all done with magic.
That's what the end result looks like to me.
 
Last edited:
Top