Question about iNavX v Navionics iPad App

Dobbies

New Member
Joined
29 Jun 2014
Messages
20
Visit site
Hi All,

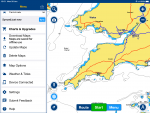
I've just purchased " iNavX" for my iPad and also subscribed to Navionics for the charts, so far it's looks and seems to work seamlessly.

I thought though that Navionics included a tidal and current direction layer on their charts which is not visible on mine. Am I wrong?

Any views would be appreciated.
 
You zoom in and find a tidal indicator: it’ll be a small icon with either red or blue fill. Tap on that icon and the tidal curve for the location will appear at the bottom of the screen. Note that whilst the tidal curve is showing, the depths on the chart will be shown as the predicted depth for the time selected. See below.

6BA1B6E2-CE77-4280-8415-5065081EBF8F.png
 
You zoom in and find a tidal indicator: it’ll be a small icon with either red or blue fill. Tap on that icon and the tidal curve for the location will appear at the bottom of the screen. Note that whilst the tidal curve is showing, the depths on the chart will be shown as the predicted depth for the time selected. See below.

View attachment 83884
My iNavX doesn’t do that - it shows the tide station in Falmouth but does not bring up the tidal
curve when I tap on it. Is there something else that needs to be installed ?
 
Thank you for your reply, but I don't have that icon. I know exactly what you mean as I have seen them before on Navionics charts as your example shows, but not on iNavX. I have purchased and downloaded the "Ayetides" app that I thought integrated into Navionics, but it works alongside it and doesn't indicate or show tidal streams.
 
Why not simply use the Navionics app if you already like the charts?
Because the Navionics app as I know it doesn't have the interfaces I require, that I'm aware of. I wish it did. iNavX however has the ability to integrate MNEA sentences wirelessly which I use for GPS, AIS, and instrument data from my Raymarine network. I have been using "QTVLM" which is free and a great as a chart plotter, but it only uses raster charts which don't knit together seemlessly like navionics charts do.
 
Last edited:
Top