Ian_Edwards
Well-Known Member
I've had opencpn for some time, only played with it until now.
The Antares charts are so good, when trying to navigate bays and inlets that it seems a shame not to have them "online" and visible in the cockpit. But you can't display Antares charts on a Raymarine MFD, so I've been trying using opencpn in the cockpit..
The problem I'm having is how to integrate Antares charts with O-charts vector charts or visit my harbour raster charts.
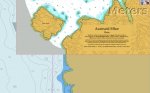
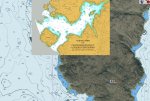
I can see the Antares charts when I zoom in, but the background chart looses any usefully resolution. When I zoom out I just see the red marker square on a base chart, or a red box on the vector chart.
Is it possible to seamlessly quilt vector charts with Antares charts using opencpn?
or am I asking too much of a bit of free software?
The Antares charts are so good, when trying to navigate bays and inlets that it seems a shame not to have them "online" and visible in the cockpit. But you can't display Antares charts on a Raymarine MFD, so I've been trying using opencpn in the cockpit..
The problem I'm having is how to integrate Antares charts with O-charts vector charts or visit my harbour raster charts.
I can see the Antares charts when I zoom in, but the background chart looses any usefully resolution. When I zoom out I just see the red marker square on a base chart, or a red box on the vector chart.
Is it possible to seamlessly quilt vector charts with Antares charts using opencpn?
or am I asking too much of a bit of free software?