New Solent banks drying above CD according to iPad Navionics

Cohoe

Member
Joined
21 Sep 2007
Messages
26
Visit site
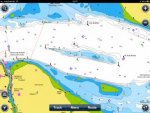
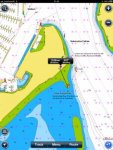
Has my beloved Solent changed so much? I've just ordered a Raymarine E7 MFD with Navionics charts. I thought I would get familiar with the charts by studying my iPad UK & Holland HD Navionics Chart and have noticed new drying banks between Peel & Mother Bank (+1.4m). Bramble Bank now sinking (+0.6m). Has there been a recent survey or a mistake? The difference in just a few years is astounding. I've sailed the Solent 45 years and can't recall such a massive change. I didn't notice any breaking water at low water (1.6m) last week. My iPad 1 Navionics chart HD 2012 shows at least 3m depth previously. My portable Garmin GPSmap 76CSx 2009 shows 3.1m. Also the Inner Swashway at Portsmouth entrance seems to have moved offshore, closing the outbound route inshore of BC Outer. The Navionic chart shows a drying spit extending 100m offshore. Now that I would have found with my keel by now. I was just starting to gain faith in Navionics charts and order a Raymarine E7 plotter. Perhaps my out of date Solent paper charts 2005 are more valid.
Has anyone else found these curious chart updates ?
 

Attachments

  • IMG_0392.jpg
    IMG_0392.jpg
    23.2 KB · Views: 1
  • IMG_0393.jpg
    IMG_0393.jpg
    26.1 KB · Views: 1
Last edited:
Hmm, I see what you mean - they're also on the Navionics web viewer (so whether the banks themselves are real or spurious, Navionics's update process is presumably working fine).

For what it's worth I can well believe that the Brambles is sinking - about five or six years ago I landed on it with the works dinghy club and we had loads of space to run about on; the annual cricket match this year was a very damp affair with only a tiny patch drying a few inches above the sea.

EDIT: just checked the corrections for my (Imray) paper charts. These list a new "obstruction" drying 1.4m in the position of the larger of the two new Peel banks (no mention of the smaller drying bank or the new spit off Portsmouth, but the latter in particular would be tiny on the relevant chart and perhaps not worth including as a correction). For both Imray and Navionics to have it, I assume the change must have come from an authoritative source such as the UKHO.

Pete
 
Last edited:
That's worrying! Can you give me the lat. and long. of the drying 1.4 reading? I'll have a look on my iPad Navionics to see what it says. Ta.
 
According to my Imray charts on the iPad there is an drying "thingy" to +1.4 between Peel Bank & Mother Bank buoys shown as "Obstn Rep (1986)". Lat & Lon of 50 45'.41 and 001 12'81.
 
Last edited:
According to my Imray charts on the iPad there is an drying "thingy" to +1.4 between Peel Bank & Mother Bank buoys shown as "Obstn Rep (1986)". Lat & Lon of 50 45'.41 and 001 12'81.

Yes, that's showing on my Navionics

a764d2ad6e2d2a534e8d665db0e4d621_zps476d7c00.jpg


but I never managed to find it, similarly the sub. barrier between NMLF and Ryde was reported but never seen.
 
Peel Banks Position 50 45.2N 001 12.4W 0.6nm by 0.3nm about 1nm North of Wooton Creek pier and extending towards another smaller bank in the direction of Osbourne Bay.
 
Last edited:
The obstruction first reported 1986 I think is a sunken yacht. Not found it myself but I guess someone did. Im talking about a 1/2 nm long drying Peel Bank,a smaller bank stretching towards Osbourne Bay and the inner swashway at Portsmouth Harbour. The submarine barrier NML fort to Sea view was dredged as far as the stick to 2m way back.
Regards Cohoe
 
Last edited:
The Portsmouth bit, the green area at the very bottom of the page is the well known Hamilton Bank. I've seen it dry several times, and adorned by immovable yachts many times.
There has long been a bit of a spit running from the corner of Blockhouse towards it, I suspect it moves around a bit. There are several lumps of something or other close to the inner swashway, in the Fort Monckton area, at or around chart datum. I've seen Victories stop dead well off the wall at low tide.
Mind how you go!
 
But that position is literally smack on top of a 15m contour
I think your position bears from the end of Wooton Bn. Try mine from the End of Wooton/Fishbourne Ferry pier. The small bank bears 329T/1.6nm at position 50 45.5N 001 14.1W inside the 5m contour (well it would be I suppose) between Peel Bank and Norris buoys. See attach a Navionics chart screen shot.

Re - Portsmouth Inner Swashway Passage. Since I draw 1.6m I have found I can use the inner passage inside the BC Outer stick when Portsmouth tidal height is approx 2.0m above CD and showing a minimum of 2m on the tidal gauge just inside the entrance. I was surprised to find the spit on my iPad so pronounced and now charted as extending 100m drying +1.2min in the direction of Hamilton Bank which is nearly 400m offshore at +1m. Previously I've experienced at least 0.3m below CD only a few meters off the sea wall from the corner exiting equidistant between BC Outer and the wall. So I'm commenting how the spit is charted as having become shallower and having extended its drying height much further (approx 100m) out towards Hamilton Bank (which dries at about 1m). My previous chart showed the inner passage accessible right up to the submerged concrete block foundation protecting the corner of the harbour wall. I use this passage and did not notice the difference even last week. I have never seen Peel bank dry out. So I am suspicious of the reliability of the Navionics charts of the Solent, just when I was going to purchase new equipment that use them. So I intend to make a more wary check next time out. It might be worth going over to Peel Bank to check depth there too, in order to judge the validity of the chart update. I know banks move and shift in a storm. But Peel Bank previously -3m below CD now allegedly drying out to +1.4m (higher than Brambles) ! I have my doubts so I would be interested in any observations corrected for height of tide, if you bump into it, so to speak. It appears some observers charts agree the new soundings have appeared so to be fair it might just be duff info from the Hydrographic Office that each supplier has recorded. I had better go and check for myself. I thought it may raise an eyebrow and am grateful for your verification from other sources. Imagine our racing colleagues surprise with their deep fragile dagger board keels tacking inshore towards Wooton to find a bigger drying bank than the Brambles. Its got to be a survey error surely ?

Regards Cohoe
 

Attachments

  • IMG_0392.jpg
    IMG_0392.jpg
    23.2 KB · Views: 1
Last edited:
But that position is literally smack on top of a 15m contour

More precise bearing for the smaller bank from End of Wooton/Fishbourne Ferry peir. 329T/1.6nm position 50 45.5N 001 14.1W inside the 2m contour (well it would be I suppose) between Peel Bank and Norris buoys.
Trying to attach a Navionics screen shot here.

Still deep water on my app. just south of the 5m contour.

e7592db316156f35ddf99a3db79d4ae0_zps83b89cef.jpg


The reason this interests me so much is we now keep our boat in Brittany and with 10 metre tides and a LOT more rocks than I am used to on a regular basis I have considered the Navionics app to be an accurate back-up should I lose my Garmin chartplotter.

To date I have only found one buoy that didn't match the app (SE Minquiers) and all the leading line info has been spot on. I guess in one way I'm fortunate ... the rocks don't move :)
 
According to my Imray charts on the iPad there is an drying "thingy" to +1.4 between Peel Bank & Mother Bank buoys shown as "Obstn Rep (1986)". Lat & Lon of 50 45'.41 and 001 12'81.

That's on my printed Imray chart, but the correction sheet then adds a further drying bank which would appear to be the same one shown on Navionics.

Pete
 
I have never fully understood how these proprietary charts work. I have always assumed that all the data comes from the UKHO .....

Not if it's complete rubbish and ended up on the chart by mistake :). Cohoe's original post implied he thought the change might be a mistake introduced by Navionics; the fact that it's also on Imray paper chart corrections suggests that this is not the case.

I assume if we looked up the appropriate UKHO NTMs we'd find it there as well, but I don't have those to hand unlike the Imray ones.

Pete
 
Clearly this is data from UKHO but it does look like a survey error. I wonder if there was a high pressure on the day the survey took place. The area near peel bank is very shallow, I passed over this area during the summer and was surprised at how little water there was. I was perviously berthed in Haslar so used to sail over this area regally, but returning after a few years absence I noticed the difference. I suspect that the survey has the profile of the seabed correct but it is possible that due to high pressure on the day of the survey the actual measurements are out by an amount. I doubt that Peel Bank and Bramble bank were surveyed the same day, because we know that Bramble dries and Peel does not.
 
The Navionics WebApp also shows updates in the area of Langstone Harbour entrance. The previously shown drying bank to the West of the harbour entrance (that never appeared to be there in reality) now looks more like reality...

Capture.JPG

Updates don't appear in my Mobile Navionics yet.. Although when I try and update the App (on the Galaxy Note) it says I already have the maximum level of detail available for the area. I'm wondering if it is really checking or just not allowing an update..
 
I have never fully understood how these proprietary charts work. I have always assumed that all the data comes from the UKHO .....

It does, or perhaps from other authorities such as the Humber Conservancy (or whatever it's called these days). Imray, Navionics, Jeppesen etc. all simply republish data from the surveying organizations.
 
Top