Neeves
Well-known member
This is me keeping my head below the parapet  . .....
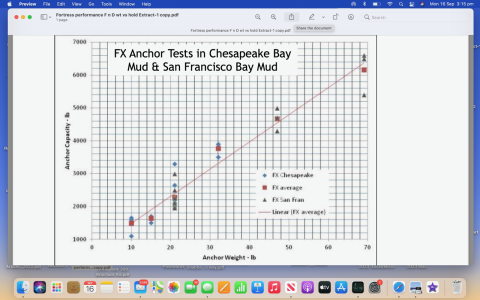
I posted this screen shot - and no-one took any notice (or if they did they were distracted).
But the data is 'odd'
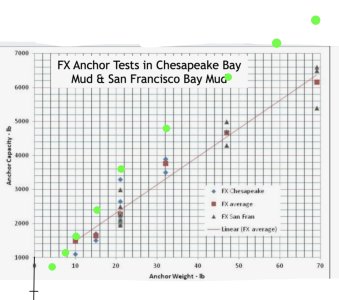
It represents most of the tests, or all of the tests, on multiple anchors of the same design. There is an unhealthy spread of data for some of the anchors but that is partially or completely ironed out by the number of tests. Calculating the average for each anchor size looks sensible and the plot, the straight line looks 'about right'.
The problem is that the line should pass through the origin, zero capacity, zero anchor weight. The line, that looks about right suggests that an imaginary anchor or zero weight will have a hold of about 450lbs. Why doesn't the line pass through zero, or at least close to zero?
I have my ideas, in fact I'm pretty sure - but I've spent too much time already exposed, I'm going down to my bunker.
Suggestions?
Jonathan


