aliyesami
New Member
I just subscribed to Navionics on Android app and was looking at the potential gulf area where we plan to buy a house. The canal depths for one of the person I know who owna s 40ft boat is shown as 0-3 ft . When i asked the guy he said the depths are 5-10 ft based on the tide which makes sense and his neighor has a 60ft boat.
How can Navionics chart be so wrong and can we rely on them ?
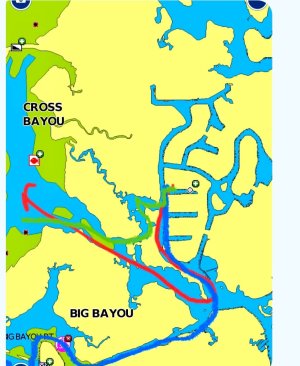
The blue line in the attached Navionics map is the route he takes . And not only wrong depth , near the marina the canal is showing totally blocked (green color) , which is also not correct .
How can Navionics chart be so wrong and can we rely on them ?
The blue line in the attached Navionics map is the route he takes . And not only wrong depth , near the marina the canal is showing totally blocked (green color) , which is also not correct .