Reeds Skipper's Handbook (7th Ed) - Finding depth to anchor

ulix

New member
Joined
18 Sep 2023
Messages
4
Visit site
Hello Everyone,

I'm currently reading Reeds Skipper's Handbook (7th Ed) this is to prepare for the RYA Day skipper course I want to do.

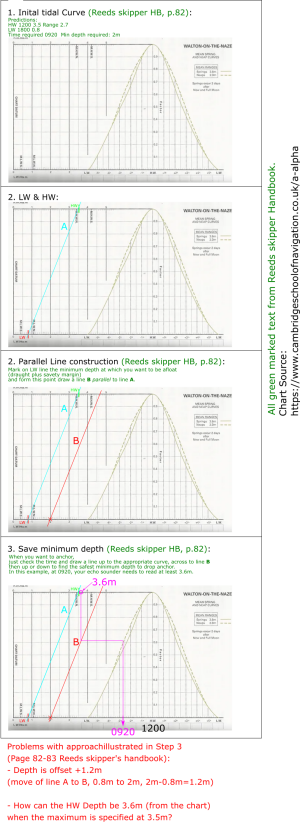
Now I did stumble at pages 82-83 finding depth to anchor. It doesn't really make sense to me, how and what is explained on these two pages.
I do understand how line A (black line) on page 83 is constructed. But then line B (red), which is parallel to A (B is just +1.2m offset to A). Then the book says the save anchoring depth can be read from line B (red).
As an example it is stated that at 9:20 the depth should be 3.6m, but why? It should be 2.4m from line A. HW is 3.5m how then can it be deeper than HW?

Can someone explain, who has read/owns the book and understands that? Or is there a possibility to contact the authors?
Thanks
 

Roberto

Well-known member
Joined
20 Jul 2001
Messages
5,377
Location
Lorient/Paris
sybrancaleone.blogspot.com
I don't have the book, but problems of this kind are just a matter of additions and/or subtractions so if one knows the exact question there will be an answer :)
A typical one is: "I arrive at an anchorage, what is the least depth I have to read on the sounder to be safe with my given draft (Dr), say 2m?"
Several ways, one is trying to visualize how the different elements fit together:
1. Determine height of tide at the time you arrive (Ht). Say it's 5m.
2. As you read depths D on the sounder, the local sounding LS will be D-Ht. This is the figure that would appear on an hypothetical high definition nautical chart at the exact coordinates you are on.
Case a) If you measure 8m, the local sounding would be 3m;
Case b) If you measure 3m the local sounding would be underlined 2 (that spot dries by 2m at LAT)
3. Check on the tide tables which will be the lowest LW (call it LLW) during the period you plan to be in the anchorage; for overnight anchoring it may be just the next LW, if you plan to remain one week then look through 7-8 days of data. Say this is 1m.
Now: the lowest depth you will have to face during your stay will be LS+LLW, ok? The Local Sounding + the height of tide at the next lowest low water.
Re Case a) LS= 3m, the lowest depth of the spot will be LS+LLW=3+1=4m. Your boat will float.
Re Case b) LS=underlined2=-2, lowest depth LS+LLW=-2+1=-1 --> the spot will dry by 1m . Your boat will be seriously aground.

Ok then: what LS will make your boat just touch the ground at LLW,with Draft (Dr)=2m?
It will be when Dr=LS+LLW (your Draft Dr=Local Sounding+Lowest Low Water). Substituting: 2=LS+1, hence LS=Dr-LLW=2m-1m=1m
If your 2m draft boat is exactly on a spot with a Local Sounding of 1m, you will touch the ground at the next LLW as the height of tide at that time will be 1m. Ok?
So you need a place (better, an area) with a Local Sounding higher than 1m.

Now, back to point 2. You are circling the anchorage, the height of tide is 5m, you need a LS of at least 1m. LS being D-Ht, you need to find an area with at least 6m of water: with a depth of 6m and height of tide 5m, the local sounding will be 1m, as the next LLW is 1m you will have a least 2m of water under your keel during your stay.
Finally, the very minimum depth you can accept to read on your sounder while circling the anchorage will be
Dr+Ht-LLW
In the above case: 2m+5m-1m=6m
Summing up: determine height of tide at time of your arrival, add your draft, subtract the height of the next lowest low water and you have the very minimum depth you must read on your sounder over the area the boat will remain. Adjust for safety factors, atm pressure etc etc all the usual precautions.

They may then ask: "how much anchor cable will you lay?" Say you anchor with 7m depth and decide a scope of 5ish, what about 35m of chain?
With a depth = 7m and Ht height of tide 5m, LS is 2m --> now you must check the tide tables again to see which will be the Highest High Water during you period of stay, as the maximum depth you will measure will be LS+HHW. If HHW is 10m, LS is 2m --> the highest depth you will float on will be 12m, so (let's forget the height of the bow over water) you will have to pay out 60m of cable. Note if you had calculated your cable length with the depth at the time of anchoring (7m) you would have used 35m only, meaning that at HHW your scope would have been roughly one half of the intended one. One of the reasons sometimes one sees boats drifting away from the anchorage at HW :)
Hope this helps
 

awol

Well-known member
Joined
4 Jan 2005
Messages
6,832
Location
Me - Edinburgh; Boat - in the west
Visit site
Then try and remember whether the sounder is set for water depth, depth under the keel or depth under the sounder. And, of course, if you have such a poor anchor, or are just antisocial, to use a scope of 5 you need to check that 60m(ish) away from where you dropped there is enough water at LW. Oh, and beware slopey bottoms and offshore winds.
 

ulix

New member
Joined
18 Sep 2023
Messages
4
Visit site
Hi,

thanks a lot to you both @Roberto and @awol for your replies! @awol I'm not able to contact you via PM, is there a possibility to contact you, since you are in Edinburgh, me too...

Everything that you mention does seem reasonable. I have created an image to specify what is explained in Reeds on the pages in doubt. I've taken the same tidal graph as in the book (Walton on Naze), the quality is not the best, but it is the only graph I found.
Does the mentioned process in Reeds make sense to you guys?

reeds_save_anchor.png

thanks o_O
 

awol

Well-known member
Joined
4 Jan 2005
Messages
6,832
Location
Me - Edinburgh; Boat - in the west
Visit site
The curve represents the tide depth profile no matter where it is in the spring/neap cycle. The Line A is drawn for the range of tide for that day between HW and LW. At spring tides the slope is different to neaps which gives a line closer to vertical. What I see is that if you anchor so that your keel just brushes the bottom at LW then at 09.20 the depth would be 2.4m (from line A). With 1.2m as a minimum depth at LW then you need 3.6m under you at 09.20. You need to talk to someone to sort out your understanding
 

ulix

New member
Joined
18 Sep 2023
Messages
4
Visit site
Thanks for your reply @awol. I think I need to specify that the graphs drawn in Step 1 to 3 are not my doing - this is how it is done in Reeds Handbook. I have not added anything in Step 1 to 3 and used the exact same tidal chart/graph as in the book. Meaning I have not created/read the 3.6m value at 9.20, this is how it is mentioned in Reeds book (!).

My exact understanding is that at "09.20 the depth would be 2.4m", as you mention. And that is exactly my problem because in step 3, Reeds handbook (magenta line) gets a depth of 3.6m at 9.20. I'm not sure why line B is moved (parallel) to intersect at LW at 2m this seems not correct to me... it creates an +offset of 1.2m! This would be quite dangerous... as of my understanding. I think the book is fundamentally wrong in its description...

PS: sorry I don't want to attach a scan of the pages since I'm not sure if this is allowed due to copyright reasons.
cheers
 

dunedin

Well-known member
Joined
3 Feb 2004
Messages
13,954
Location
Boat (over winters in) the Clyde
Visit site
Seems awfully complicated! I have successfully anchored many hundreds of times (well over 50 times this year alone) and never phaffed around drawing lines on a tidal curve.
Clearly it may be more important with complex tidal curves (eg double high water areas) but all I have ever done is
1. make a rough calculation of current height of tide (HoT) using Rule of Twelfths
2. thereby quick calculation of how much likely to drop from now at lowest LW when at anchor (HoT - LW height) - to avoid running aground
3. ditto quick calculation of how much will go up from now (HW height - HoT) - to decide how much scope of chain might be needed.
All can be done in my head whilst approaching the anchorage. Then find spot based upon charted depths, checking actual depths on the sounder (which should be roughly charted depth plus HoT -2m keel offset).
Nowadays generally even skip step 1 (rule of twelfths) by quickly opening phone, which shows current height of tide via an Absolute Tides widget on the home screen. (It even does many secondary ports if I am being fussy - but generally an extra metre safety margin works just fine.)
I appreciate that my pragmatism may not suit RYA Examiners, but I am more concerned about Neptune’s practical judgement than Examiners.
 

awol

Well-known member
Joined
4 Jan 2005
Messages
6,832
Location
Me - Edinburgh; Boat - in the west
Visit site
Thanks for your reply @awol. I think I need to specify that the graphs drawn in Step 1 to 3 are not my doing - this is how it is done in Reeds Handbook. I have not added anything in Step 1 to 3 and used the exact same tidal chart/graph as in the book. Meaning I have not created/read the 3.6m value at 9.20, this is how it is mentioned in Reeds book (!).

My exact understanding is that at "09.20 the depth would be 2.4m", as you mention. And that is exactly my problem because in step 3, Reeds handbook (magenta line) gets a depth of 3.6m at 9.20. I'm not sure why line B is moved (parallel) to intersect at LW at 2m this seems not correct to me... it creates an +offset of 1.2m! This would be quite dangerous... as of my understanding. I think the book is fundamentally wrong in its description...

PS: sorry I don't want to attach a scan of the pages since I'm not sure if this is allowed due to copyright reasons.
cheers
Line A represents the depth of water above chart datum and is used with the curve to get that depth at a particular time before or after HW. Line B is simply a shift of 1.2m meaning there is 2m above chart datum at LW and 3.6m at HW.

Dunedin is being pragmatic while Ulix is studying for a piece of paper.
 
Last edited:

MontyMariner

Well-known member
Joined
7 Apr 2011
Messages
800
Location
Somerset / Dorset border
montymariner.co.uk
Do people really go into that much detail?
Anchoring in areas without an excessive range or depth, my start point is to drop 20mtrs of chain into the water then put more out if conditions warrant it.
Reconsidering my initial thought, yes you do need to know how to do the calculations before you are comfortable with making "adjustments".
Maybe I should ask - With experience, do you still do all the calculations?
 

B27

Well-known member
Joined
26 Jul 2023
Messages
2,068
Visit site
The issue is to understand the tidal data, graphs and the tools which go with it.

How much is the tide above Chart datum at the time you will anchor?
You use the curve to interpolate between HW and LW depths which you may have had to correct from a standard port.
How much will it be above CD at low water?

So you know how far the tide will drop.
So when you anchor you want enough water that it will drop to the safe depth you want at LW.

Everybody seems to add and subtract things in different orders to hopefully get the same answer.
You can work in depth under the keel or depth from the surface or depth under the sounder, you can keep converting from one to another. You can have your safety margin in your depth sounder correction if you want.

The thing is, to know what every figure actually means. A lot of people find it helps to draw a picture with the different things labelled. Some people use names like 'rise of tide' a bit casually so people can be at cross purposes.

Personally, yes, I do some of the calculations, because I have a drying mooring.
 

jamie N

Well-known member
Joined
20 Dec 2012
Messages
6,273
Location
Fortrose
Visit site
I made up this in Excel which was easy enough. The page doesn't work here, but in excel, or rather 'Google sheets'. it's protected, and the only inputs allowed are those in red.
Screenshot 2023-09-19 16.30.22.png
Here it is with the workings, it was easier to post like this than as a working example. It's not a scientific piece, but is a 'good enough' working checker in my view.
Screenshot 2023-09-19 16.42.40.png
 

Attachments

  • Screenshot 2023-09-19 16.30.22.png
    Screenshot 2023-09-19 16.30.22.png
    22.7 KB · Views: 3
Last edited:

B27

Well-known member
Joined
26 Jul 2023
Messages
2,068
Visit site
Writing a spreadsheet is dead handy, but what the examiner will be looking for is the ability to understand the published info in its normal form and use the standard tools to get the approved answer.

The tools you are allowed may be restricted to a pencil, a ruler and extracts from the almaniac.

I get the impression that the core of this exercise is to use the published curve with its scales at the side to perform a graphical interpolation.
One might note that they've chosen a very pointy curve. This means that the rule of twelfths won't give the answer they seek. **
To get the answer they seek, one must use the method they suggest. The exam is about the ability to use the method, not giving them a number which they like.

The main thing you need to understand is WTH is the curve?
It's a graph of % tide (AKA 'factor') on the y axis, against time on the x axis, centred on HW.

So for instance 4 hours before HW, the factor is 0.28
That means 28% of the rise between LW and HW has happened.


Then you have the blue line labelled 'A'.
That goes from the LW height above CD to the HW height above CD.
that's 0 factor = LW and 100% = HW.
So reading across your 0.28 gives you the height above CD. It's a simple ruler and pencil way of doing 'low water + 28% of ( the difference between HW and LW)'

So you have two graphs factor vs time and 'height above CD vs factor'
You read across the line and the curve to know height at any time, or the time for any height.

The object of the game is to demonstrate you understand those graphs and can use them.

Personally, I don't think drawing in extra lines like 'B' is much help, it's just A with an offset which might mean different things to different people. In this case it is a graph of 2m + factor x (difference between HW and LW), so it's shifted the minimum to 2m instead of the predicted 0.8m of LW.
So reading across to that line from the curve gives you the depth to look for which is 1.2m below CD.


** I say 'answer they seek' as distinct from 'correct answer' because the tide curve and heights are really only 'correct' at the location of the tide gauge, not in the middle of the bay, and the tide doesn't stick rigidly to the predictions in the book. Much of the time 'we're a bit after half tide, call it two and a half meters' is as accurate as doing the sums.

This is all somewhat flawed, because morning and evening LWs are not the same, It would be better to do less colouring in, just look at the lowest LW you're staying for, relate that to a charted depth and use the graph for the current depth.

Todays evening LW at W-on-N is 0.64m, this morning's was 0.85.
Walton-on-the-Naze Tide Times | Tide Times

So you want to park the boat in min 2m of water, that's 2-.64= 1.36m charted.
Add that to the current height of tide from the curve/line A and park with that on the sounder.
 
Top