Dave100456
Well-Known Member
Hi
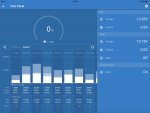
The two pics show data from my port solar panel. For those not familiar with Victron bluetooth controller, the 3 shades represent Bulk, Absorption and Float times.
I have had 10 weeks living aboard with new batts and no charge or capacity problems. An independent battery monitor has shown the house bank capacity 100% in the day on float and down to a low of 85% in the morning after a night at anchor. This equates correctly to the loads that have been drawing power during the night.
I am curious why the data from the Victron log of batt voltage shows a low of 11.58 (which would indicate sub 20% capacity). Is this low voltage figure captured as it happens for a just a millisecond or so when a high load consumer is switched on or is it something else?
Thanks
Dave

")